Fig. 1.

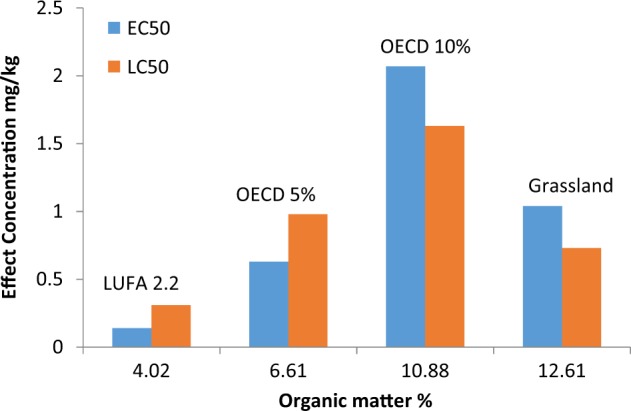
Bar chart showing the relationship between effect concentrations (LC50 and EC50) for the toxicity of imidacloprid to Folsomia candida and the organic matter content of the four test soils

Bar chart showing the relationship between effect concentrations (LC50 and EC50) for the toxicity of imidacloprid to Folsomia candida and the organic matter content of the four test soils