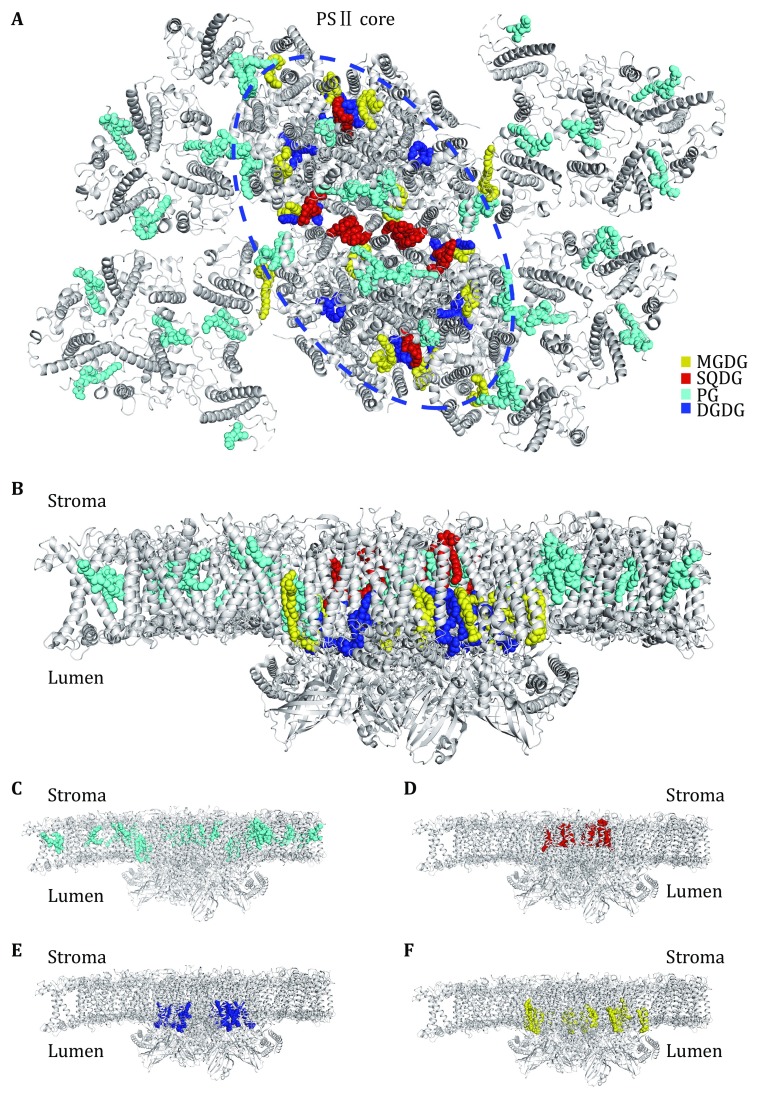
Fig. 2.
Overall distribution of lipid-binding sites within the C2S2M2 PSII–LHCII supercomplex from Pisum sativum. A Top view of the supercomplex from the stromal side. The lipid molecules located within the supercomplex are highlighted as colored sphere models, while the proteins are shown as silver cartoon models. The pigments and other cofactors are omitted for clarity. B Side view of the supercomplex along the membrane plane. C–F Asymmetric distributions of PG (C), SQDG (D), DGDG (E) and MGDG (F) across the membrane-embedded region within the supercomplex

