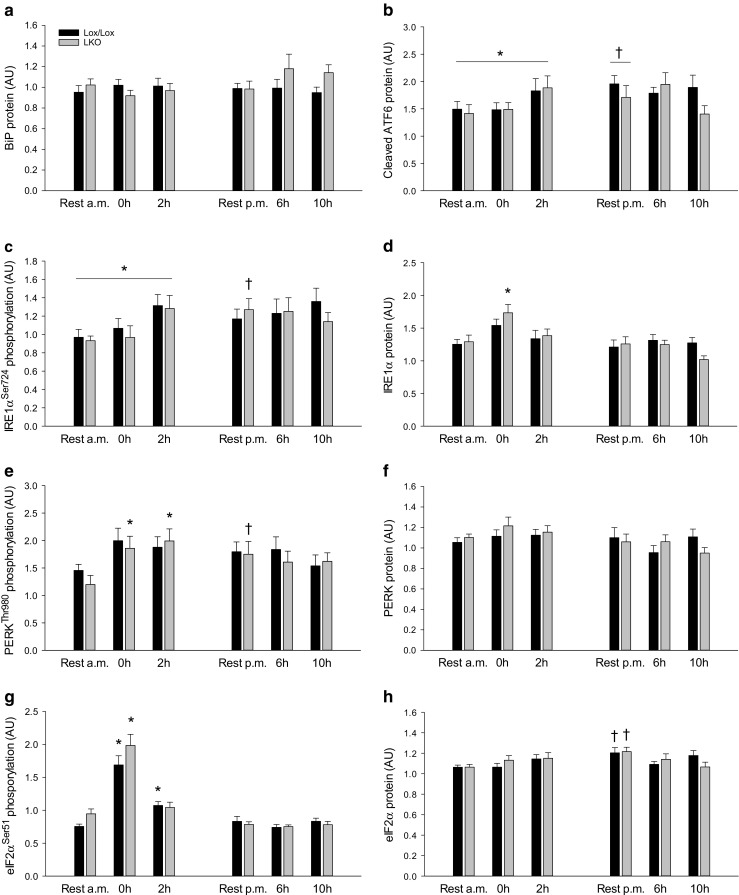
Fig. 3.

Hepatic BiP protein (a), cleaved ATF6 protein (b), IRE1αSer924 phosphorylation (c), IRE1α protein (d), PERKThr980 phosphorylation (e), PERK protein (f), eIF2αSer51 phosphorylation (g), and eIF2α protein (h) content in liver-specific PGC-1α knockout (LKO) and littermate floxed (lox/lox) mice at rest and 0, 2, 6, and 10 h into recovery from 1-h treadmill running. Resting mice were either euthanized at time points corresponding to 0 and 2 h (rest a.m.) or 6 and 10 h (rest p.m.). Protein content and phosphorylation are given in arbitrary units (AU). Values are presented as means ± standard error (SE); n = 8–10. A single asterisk is significantly different from rest within given genotype, p < 0.05. A single dagger is significantly different from rest a.m. within given genotype, p < 0.05. Horizontal line indicates a main effect, p < 0.05
