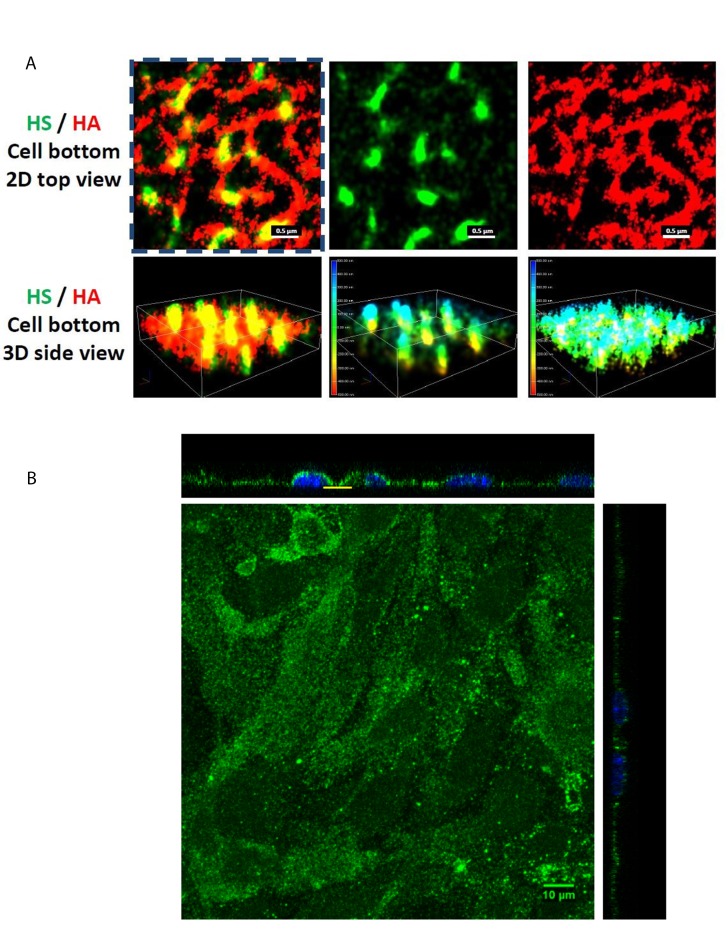
Figure 4.
ESG components and ultrastructure visualized by STORM and by confocal microscopy (A) STORM images of the anti-heparan sulfate (HS) (green, middle panel) and anti-hyaluronic acid (HA) (red, right panel) of the ESG focusing at the bottom of a bEnd3 cell. The left panel is the overlay [21]. The color bars in the middle and right panels at the bottom row (3D side views) are the scale bars in nanometer. (B) Confocal images of the same anti-HS labeled ESG of the bEnd3 cells (mouse brain microvascular endothelial cell) [55]. Yellow line indicates the region for the STORM images.

