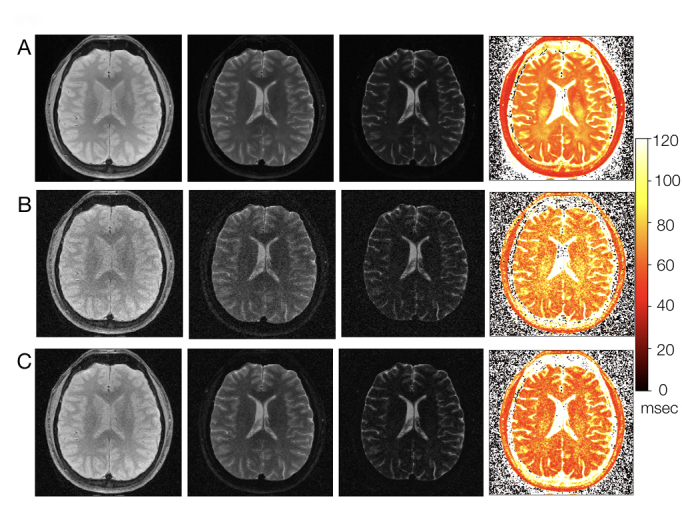
Figure 2.

A. Ground truth multi-TE images (panel 1, 2 and 3 with TE = 10, 80, 120 msec, respectively) and T2 map (panel 4: derived from 11 TE sampling between 10 and 140 msec). B. Multi-TE images with mathematically added Rician noise (with SNR = 1.5 in images with TE = 140 msec) and the derived T2 map. C. Multi-TE images processed with Rician bias correction and PCM-PCA denoising (the first three panels) and the derived T2 map (the fourth panel).
