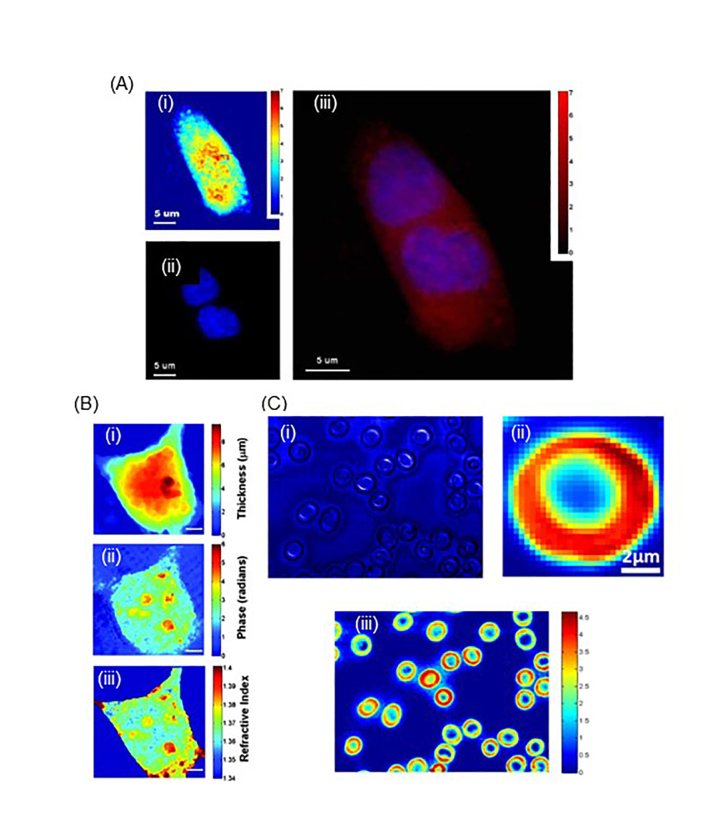
Figure 2.
2D QPI with other correlative imaging techniques. (A) Through this imaging technique, the mitosis of a kidney cell was accurately visualized both through quantitative phase image, fluorescence image, and their overlaid image. (B) Through this technique, axially averaged refractive index of cells was determined. This was used for the calculation of protein concentrations. (C) Through this multimodal imaging system, normal and P. falciparum-infected red blood cells (RBCs) were analyzed to have different morphology and hemoglobin distribution of the RBCs, which were determined by QPM and confocal Raman microscopy, respectively. (A-C) are modified from refs. [68,69], and [44], respectively, with permissions.

