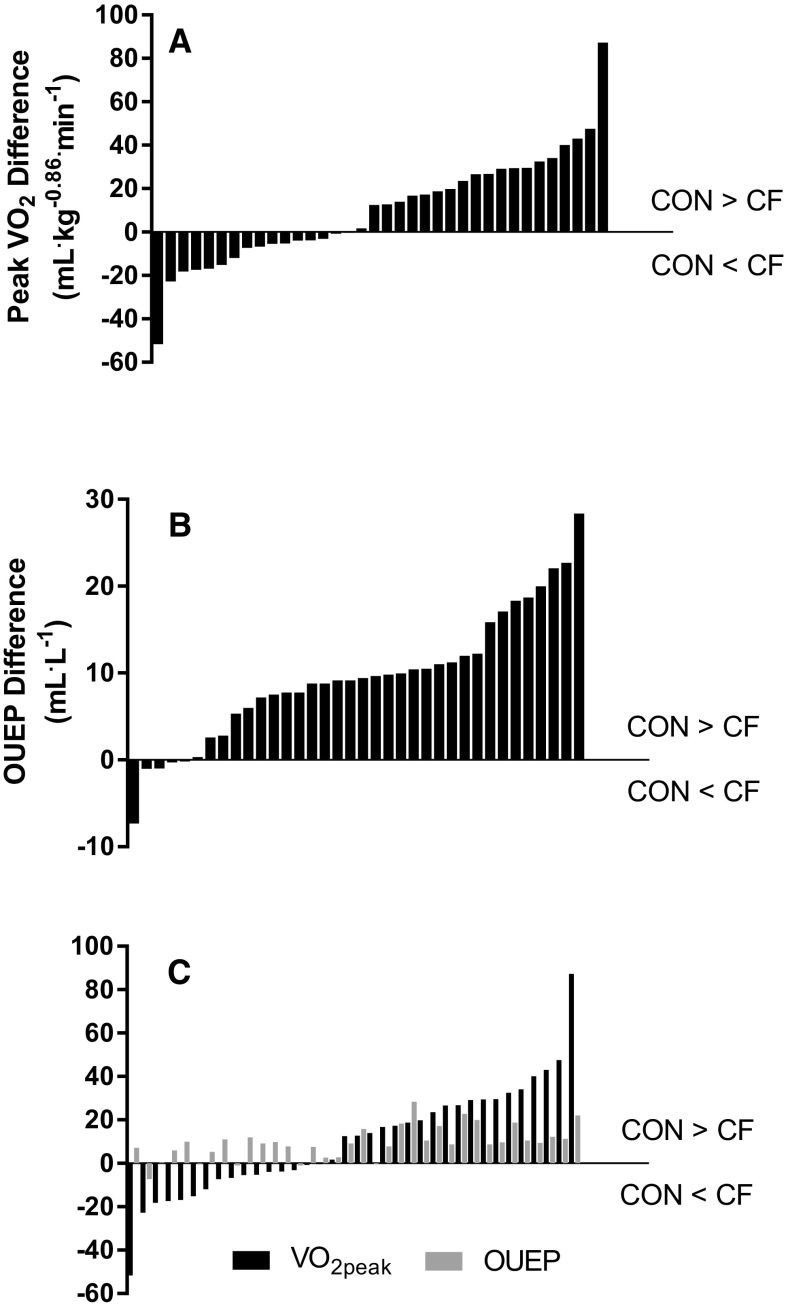
Fig. 3.
Individual differences between age- and sex-matched CON and CF pairs for CPET-derived variables. All plots are calculated as CON minus CF, i.e. bars underneath y = 0 on x-axis indicate participant with CF has a greater value than CON counterpart. a Differences in allometrically scaled between pairs. b Differences in OUEP between pairs, independent of differences in . c Differences in (mL kg−0.86.min−1) between pairs, plotted alongside within-pair differences in OUEP (mL L−1). Black bars represent and grey bars indicate OUEP

