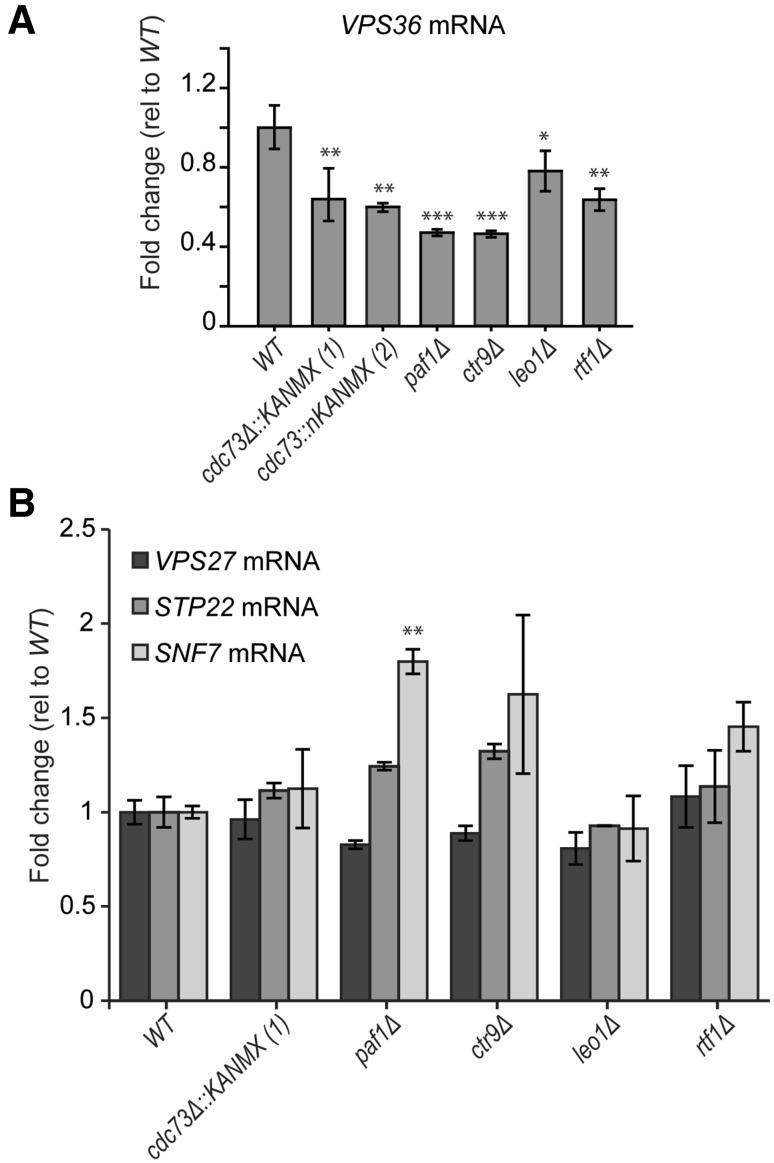
Fig. 3.
PAF1 complex controls VPS36 expression. a, b RT-qPCR analysis of VPS36 (a), STP22 (b), VPS27 (b) and SNF7 (b) RNA levels. RNA from two independent strains was measured as described in Fig. 2d. Statistical analyses used the two-tailed unpaired T test (*P < 0.05, **P < 0.01 and ***P < 0.001)

