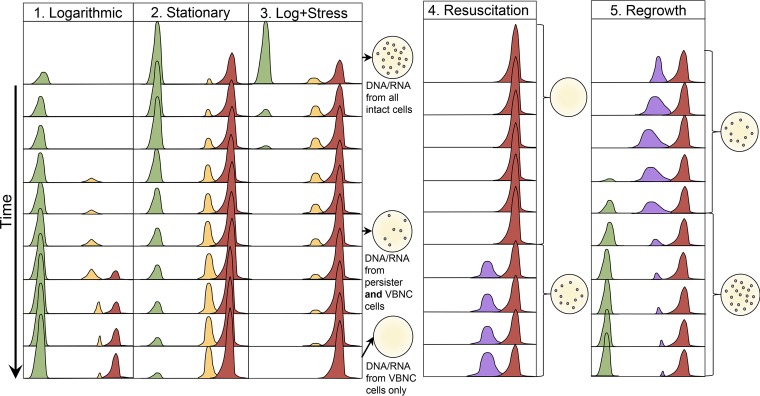
FIG 5.
Model of population dynamics as part of the dormancy continuum. Each column numbered 1 to 5 represents a different phase or treatment. Actively growing cells are represented by the green curve, persister cells are represented by the yellow curve, VBNC cells are represented by the red curve, and resuscitated cells are represented by the purple curve. Each set of curves represents a snapshot on an arbitrary time scale that proceeds downwards. 1) In logarithmic phase, persisters start to form and transition to the VBNC state. Persisters are in a transitory phase and exist at a low number, while VBNC cells represent deep dormancy and accumulate over time. 2) As stationary phase progresses, the number of transitioning persisters increase and reach a steady state with the VBNC population, while actively growing cells decline in number. 3) When logarithmic-phase cells encounter a stressful condition, some actively growing cells rapidly enter the persister state, while many susceptible cells die. Over time, with continued stress, these persisters will transition to the VBNC state. The drawings of petri plates to the right of the curves represent the culture status of the population. It is important to note that there are scenarios (pictured) when only persisters are culturable but DNA/RNA studies would be affected by genomic material from both persisters and VBNC cells. 4) Resuscitation is a variable process depending on the inducing stress and the species being studied but will eventually lead to regained culturability in a large portion of the remaining population. Even after resuscitation, some VBNC cells remain. Resuscitated cells may be in a unique physiological state and are likely antibiotic tolerant, as they are not actively dividing. 5) Regrowth occurs when resuscitated cells that have regained their ability to grow transition back to a rapidly growing phenotype when nutrients are supplied.

