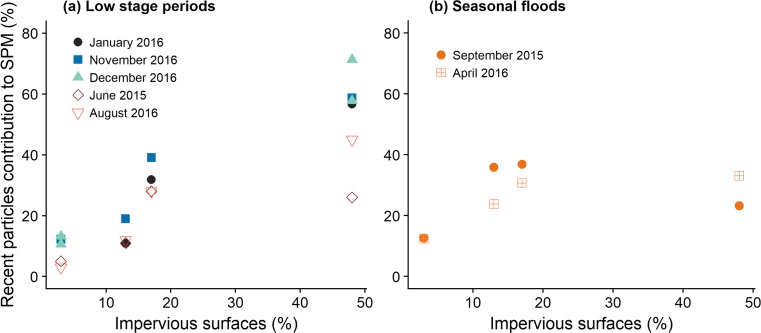
Fig. 6.
Relationship between the proportion of recently tagged particles and of impervious surfaces in a 5-km wide area around each monitoring station and for various hydrological regimes ((a) Low stage periods: Jan. 2016, Nov. 2016, Dec. 2016, Jun. 2015, Aug. 2016 and (b) Seasonal floods: Sept. 2015, Apr. 2016)

