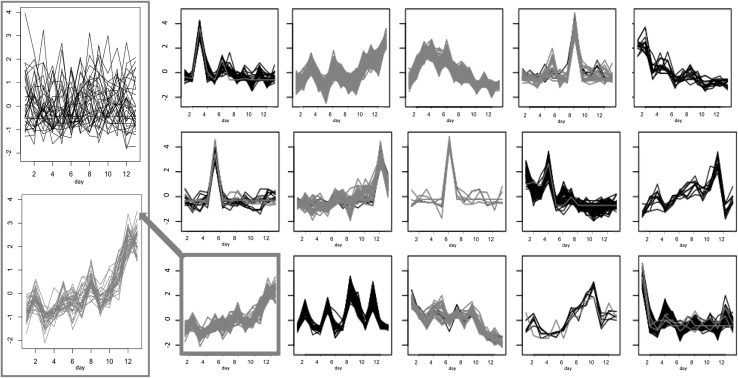
Fig. 4.
Results of k-means cluster analysis of time series for groups C (control, black) and Fusarium infected (F, red) for negative mode root (R-). The x-axis corresponds to time and the y-axis to peak intensity. Cluster 11 (highlighted) contains all sucrose peaks for group F and is expanded on the left with the corresponding peaks for group C above showing no overall trend

