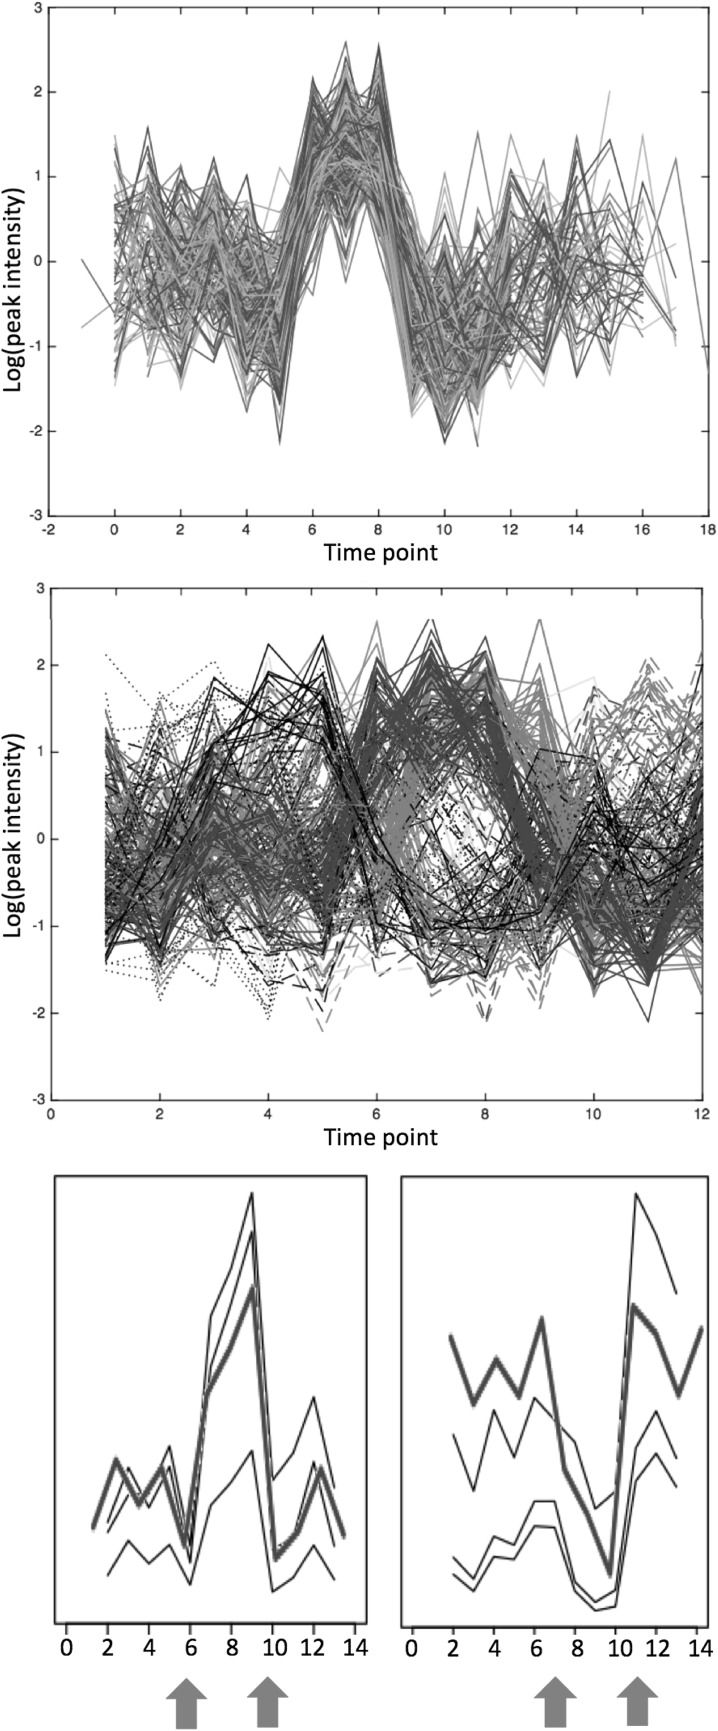
Fig. 6.
Cluster 40 from TCAP analysis, with time series for sucrose from both leaf and root from the dual stress (FD) group clustered together. Top: time series for all peaks within the cluster, shifted to reveal the general profile. Middle: time series coloured according to unshifted patterns. Bottom: sucrose time series from group FD for root (right) inverted and delayed by 1 day from leaf (left). The red arrows indicate the start and end days of the major concentration increase/decrease

