Fig. 4.
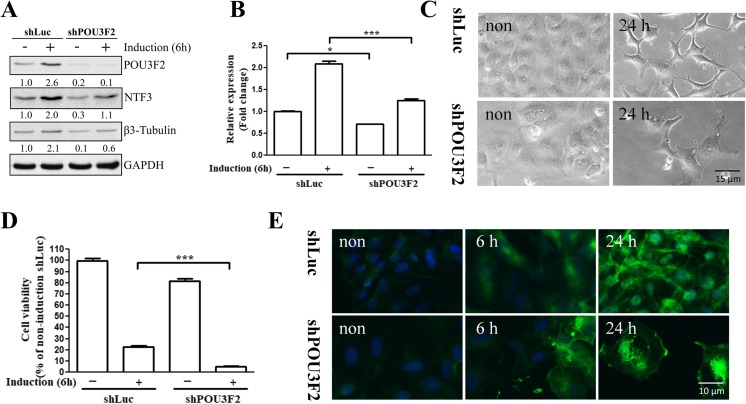
Effects of POU3F2 silencing on neuronal differentiation and NTF3 expression in NT2D1 cells. a POU3F2 expression in POU3F2-knockdown (shPOU3F2) and control (shLuc) NT2D1 cells was determined by Western blot analyses after neuronal induction for 6 h. GAPDH was used as a loading control. The values represent the relative expression compared with that of the non-induced shLuc cells (to which a value of 1 was assigned). b NTF3 mRNA expression of the cells described in a was analyzed by real-time PCR. mRNA levels were calculated relative to that of the non-induced shLuc cells. *p < 0.05; ***p < 0.001. c Neuronal morphology of shLuc and shPOU3F2 cells that were treated with neuronal induction medium for 24 h or left untreated (non). d Quantification of cell numbers of shLuc and shPOU3F2 described in c. All the percentages of the shLuc and shNTF3 cells were compared to that of the non-induction shLuc cells (to which a value of 100% was assigned). e β3-tubulin staining was performed on shLuc and shPOU3F2 cells, which were treated with neuronal induction medium for 0, 6, or 24 h or left untreated, after which neuronal cells were detected. Values represent the mean ± SEM of three independent experiments for b and d

