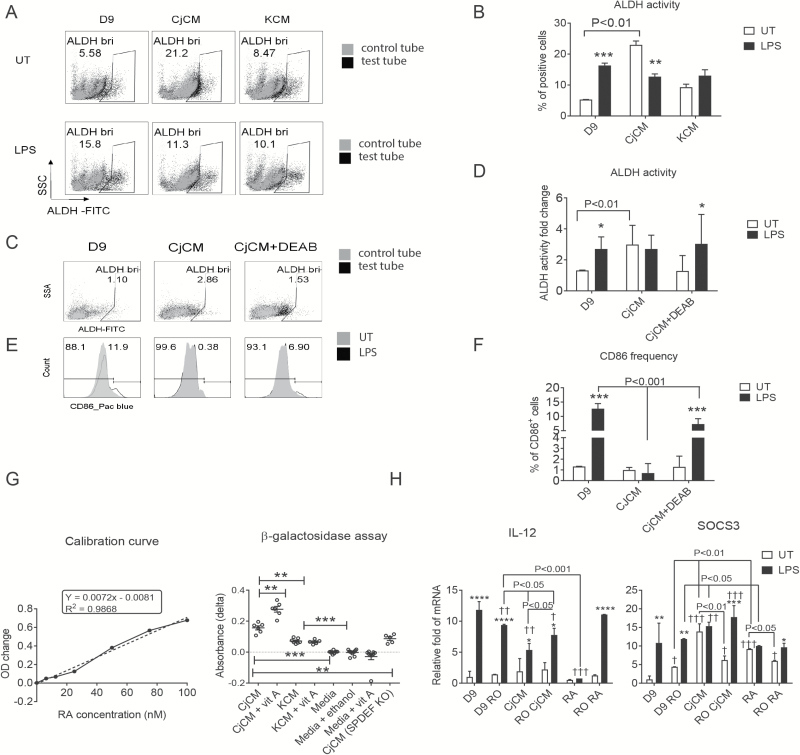
Fig. 6.
Conjunctival goblet cells condition ALDH activity in BMDCs and produce RA. (A) ALDH activity assayed in BMDC treatment groups on day 9, with DEAB-treated cells (gray dots) serving as a negative control for ALDH staining, revealed that CjCM increased the percentage of ALDH+ cells (ALDHbri), n = 3 and experiment performed three times. (B) Statistical comparison of Aldefluor activity using two-way analysis of variance, *P < 0.05, **P < 0.01, ***P < 0.005 means UT versus LPS within groups. (C–F) The supernatant from the conjunctival culture treated with DEAB from day 5 to day 7 was harvested on day 11, then used to condition BMDCs on day 6 (CjCM + DEAB), with CjCM as positive control (CjCM) and media only as negative control (D9). LPS was added to each of the three groups of cultured BMDCs on day 8. After 24 h, the cell suspension was stained with the Aldefluor reagent and CD86. These studies were performed three times with n = 3 per group. (C, D) Representative dot plots (C) and statistical comparisons (D) of ALDH activity assayed in these three groups. (E, F) CD86+ cells displayed as histogram – UT in gray and LPS-treated in black line (E) and the statistical comparisons (F). (G) The F9-RARE-lacZ reporter cell cells were seeded into wells of a 96-well plate, then media (KSFM + 3% FBS), media + vitamin A palmitate (1 nM), conjunctival conditioned media (CjCM) from C57BL/6J or Spdef KO or cornea (KCM) epithelial cultures with or without vitamin A (retinol) palmitate (1 µM), or RA in different concentrations were added. After 16 h, the supernatants were removed and a β-galactosidase assay was performed. Each group was repeated three times with n = 4 per run. The absorbance (OD) values from different concentrations of RA were used to generate the calibration curve (left), and the OD values obtained with different treatment groups are shown on the right. (H) The RARα antagonist, Ro41-5253 (RO), was added to cultured BMDCs 2 h before CjCM or RA on day 6, and RNA harvested for PCR for IL-12 (left) or SOCS3 (right) after 4-h LPS stimulation on day 8. D9 = control BMDCs; D9 RO = BMDCs with 1 µM RO added; CjCM = BMDCs treated with conjunctival conditioned media; RO CjCM= BMDCs with both RO and CjCM added; RA = BMDCs cells treated with 10 nM RA; RO RA = BMDCs with both 1 µM RO and 10 nM RA added; UT = untreated (without LPS stimulation); LPS = BMDCs treated with LPS. UT versus LPS within groups: *P < 0.05, **P < 0.01, ***P < 0.005, ****P < 0.001; between-group comparisons: †P < 0.05, ††P < 0.01, †††P < 0.005.

