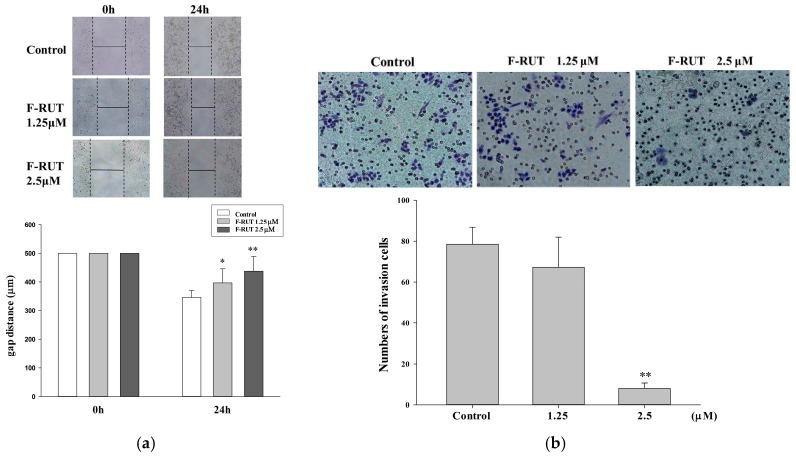
Figure 3.
Effects of 10-fluoro-2-methoxyrutaecarpine (F-RUT) on migration and invasion. Cell migration (a) and cell invasion (b) were detected following F-RUT treatment for 0–24 h, and photographed with a microscope (upper panel). The statistical analysis is shown in the lower panel. (* p < 0.05, ** p < 0.01).

