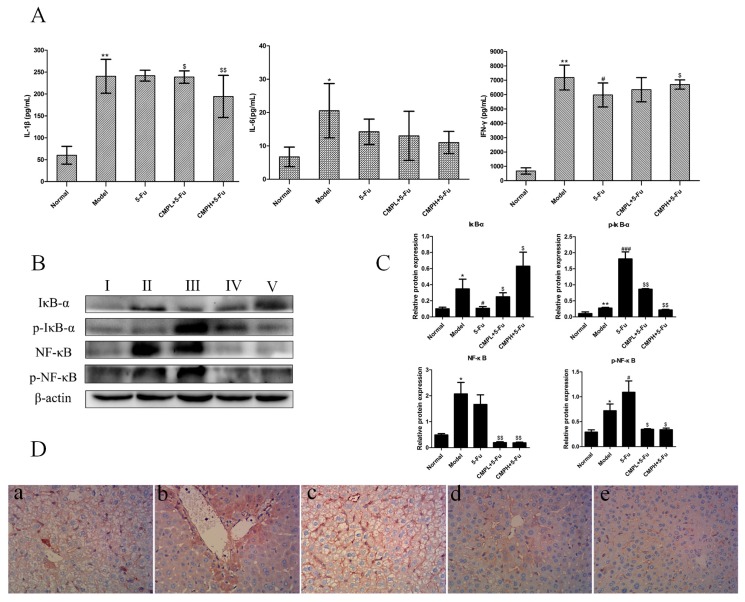
Figure 4.
Antiinflammatory effect of the combination treatment with CMP and 5-FU on liver tissues. (A) Serum levels of IL-1β, IL-6, IFN-γ. Data are presented as mean ± SD. * p < 0.05, ** p < 0.01 vs. Normal group; # p < 0.05 vs. Model group; $ p < 0.05, $$ p < 0.01 vs. 5-FU. (B) Western blot analysis of IκBα, p-IκBα, NF-κB, and p-NF-κB in liver tissues. Groups represent, І: normal mice + saline; ІІ: model mice + saline; ІІІ: model mice + 5-FU 25 mg/kg; ІV: model mice + 5-FU 25 mg/kg + CMP 50 mg/kg; V: model mice + 5-FU 25 mg/kg + CMP 100 mg/kg. (C) Semi-quantitative analysis of western blot. Data are presented as mean ± SD. * p < 0.05, ** p < 0.01 vs. Normal group; # p < 0.05, ### p < 0.001 vs. Model group; $ p < 0.05, $$ p < 0.01 vs. 5-FU group. (D) Immunohistochemical staining of NF-κB in liver tissues (magnification 400×). Groups represent, a: normal mice + saline; b: model mice + saline; c: model mice + 5-FU 25 mg/kg; d: model mice + 5-FU 25 mg/kg + CMP 50 mg/kg; e: model mice + 5-FU 25 mg/kg + CMP 100 mg/kg.

