
FIG 9.
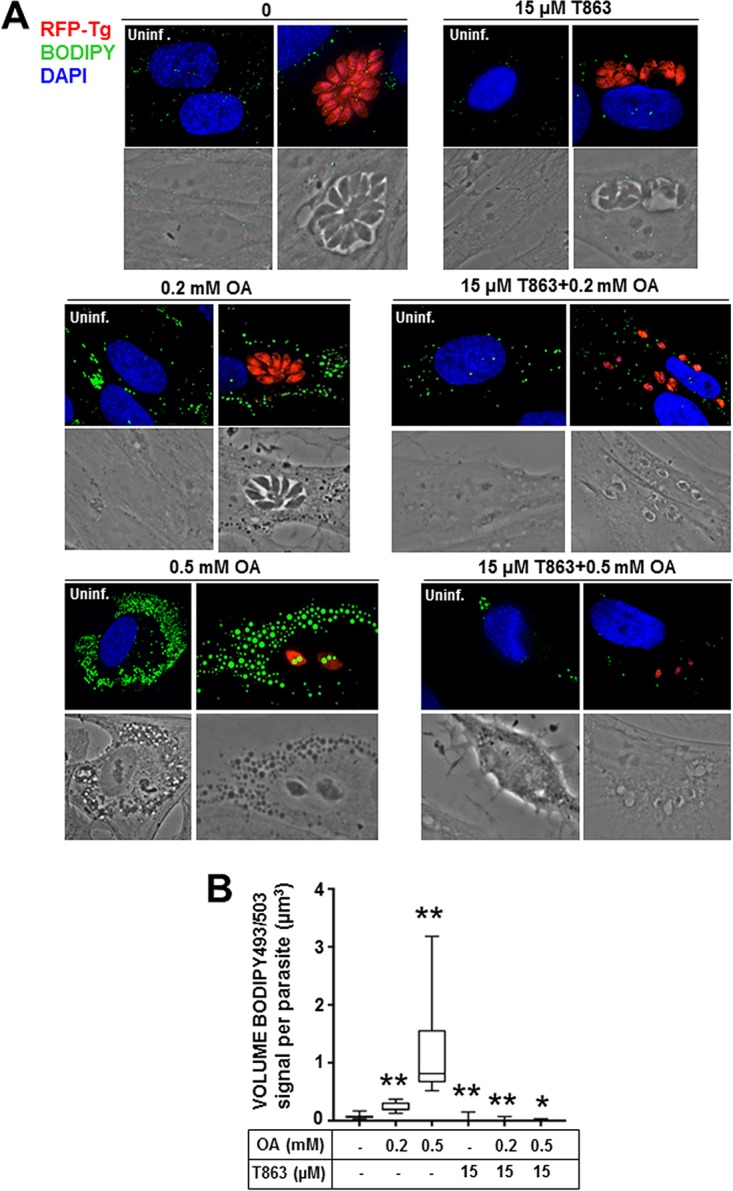
Lipid body abundance in Toxoplasma exposed to T863 and supplemental OA. (A) Fluorescence microscopy of HFF infected with RFP-expressing Toxoplasma incubated with excess OA and/or 15 μM T863 for 24 h and stained with BODIPY 493/503 (green). (B) Quantification of the BODIPY 493/503 signal in Toxoplasma cultivated as described in the legend to panel A. The graph shows the average LD volume, calculated using Volocity software, from BODIPY 493/503 staining. Data (mean volumes ± SD) acquired from three independent experiments. P values were determined by Dunnett's test. *, P < 0.0082; **, P < 0.0001.