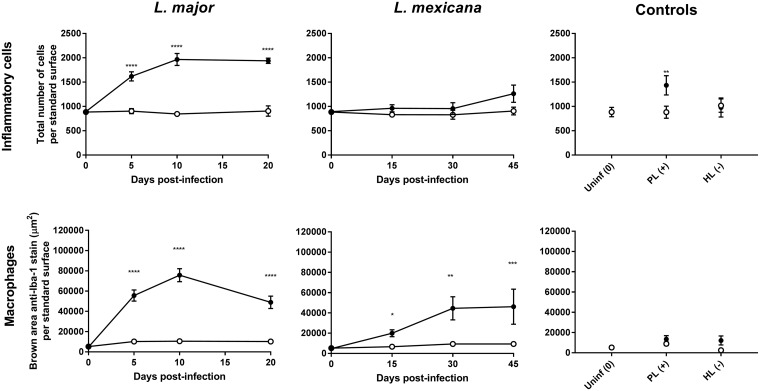
FIG 5.
Estimation of the number of cells (top row, H&E stain) and macrophages (bottom row, anti-Iba-1 reaction) at the infected lesion site (rump skin, black bars) and the control site (back skin, white bars) of control mice and CL-infected mice. Measurements in CL-infected mice with skin lesions were performed at the time when a papule, an initial nodule, or an established nodule was present on the rump (5, 10, and 20 days after L. major infection, respectively, and 15, 30, and 45 days after L. mexicana infection, respectively). Controls for skin inflammation were uninfected mice (Uninf), pseudolesion (PL; mice with carrageenan-induced inflammatory skin initial nodule), and healed lesion (HL; mice with paromomycin-cured L. major initial nodule). Standard surface was the picture area showing full skin tissue (epidermis, dermis, and hypodermis) to allow direct comparisons among groups (166,970.7 μm2). Data are shown as the means ± SEM (n = 3 to 5 per group). Statistical analysis was determined with a 2-way ANOVA, followed by Šidák multiple-comparison test. *, P < 0.05; **, P < 0.01; ***, P < 0.001; ****, P < 0.0001.

