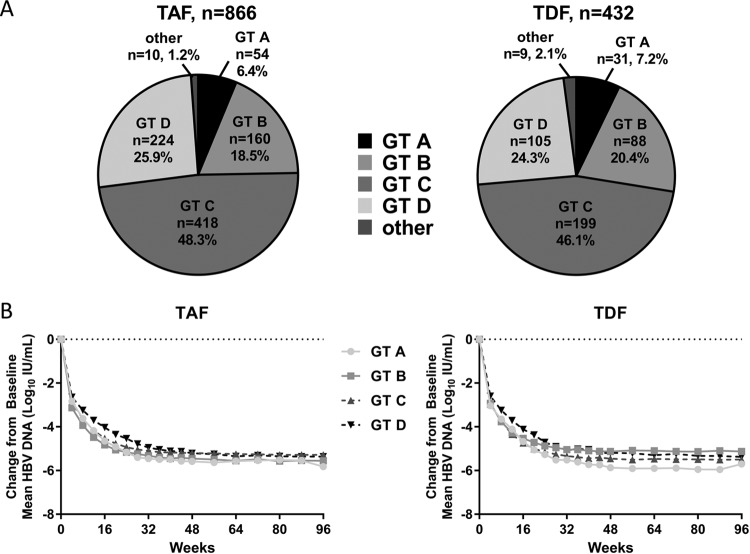
FIG 2.
Baseline HBV genotype and impact on treatment outcomes. (A) The percentages of patients in either the TAF (left) or TDF (right) treatment group are graphed by genotype as a percentage of the whole. Patients with genotypes E, F, H, or unknown are included as “other.” (B) The mean change from the baseline for patients in the TAF (left) or TDF (right) treatment groups is shown for patients with genotypes A through D.

