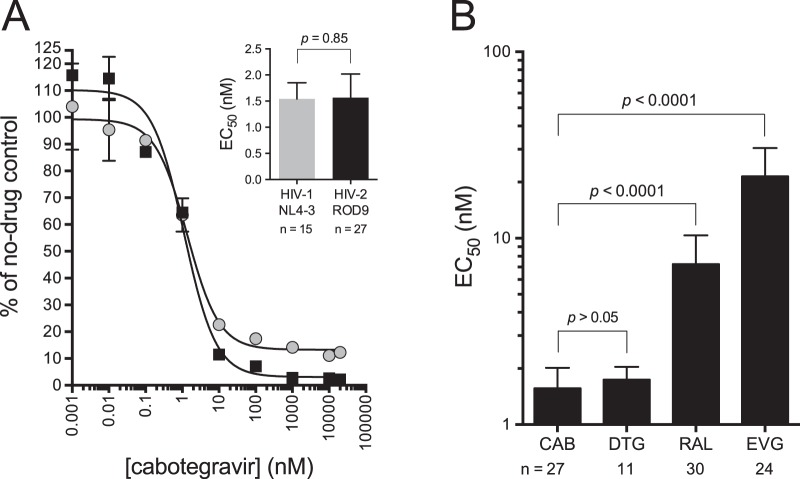
FIG 1.
Antiviral activity of cabotegravir against HIV-1NL4-3 and HIV-2ROD9. All data in the figure are from single-cycle infections of MAGIC-5A cells. Error bars indicate ±1 SD and, when not visible, are smaller than the symbols. (A) Results from a single assay in which HIV-1NL4-3 (gray circles) and HIV-2ROD9 (black boxes) were tested head-to-head. Data points represent the amount of β-galactosidase activity produced in HIV-infected cabotegravir-treated cultures relative to HIV-infected solvent-only (i.e., no-drug) controls. Each point is the mean of two cultures that were maintained in parallel. Curves were generated using a sigmoidal regression equation (GraphPad Prism 6.0 software). Mean EC50s from multiple assay runs with HIV-1NL4-3 and HIV-2ROD9 are shown in the inset. Values below the x axis indicate the total number of assay runs that were performed for each strain. The P value was calculated using Welch's t test. (B) EC50s obtained for HIV-2ROD9 tested against cabotegravir (CAB), dolutegravir (DTG), raltegravir (RAL), and elvitegravir (EVG). Data for raltegravir and dolutegravir are contemporaneous with the cabotegravir data set; data for elvitegravir were previously published (71). P values are from analysis of variance with Tukey's posttest.

