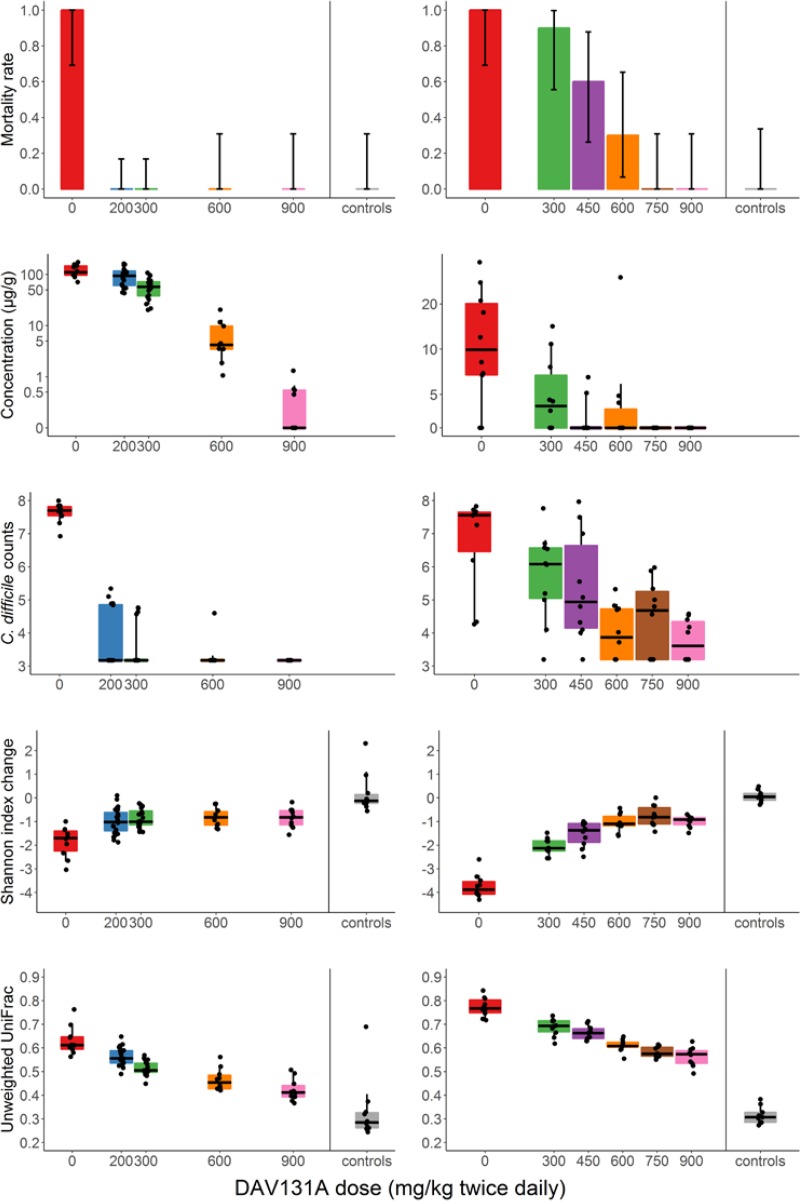
FIG 2.
Mortality rate, fecal concentration of free antibiotic at D3, C. difficile counts at D3, and change of Shannon index and unweighted UniFrac distance between D0 and D3 according to treatment group in the moxifloxacin (left panels) and clindamycin (right panels) studies. Bar plots of the mortality rates are presented with their 95% binomial confidence intervals. For concentrations, Shannon index, and unweighted UniFrac distances, the boxes present the 25th and 75th percentiles and the horizontal black bars report the median value, while whiskers report the 5th and 95th percentiles.

