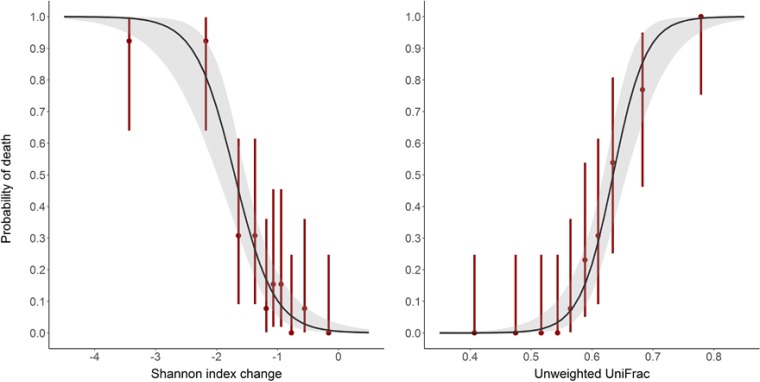
FIG 4.
Logistic models of mortality according to the change of Shannon index (left panel) (P < 10−15) and unweighted UniFrac distance (right panel) (P < 10−15) between D0 and D3 after pooling data from antibiotic-treated animals in the moxifloxacin and clindamycin studies. Red bars represent the mortality rates and their 95% confidence intervals of deciles of the observed diversity indices. The shaded areas represent the 95% confidence interval of the predicted probability of death.

