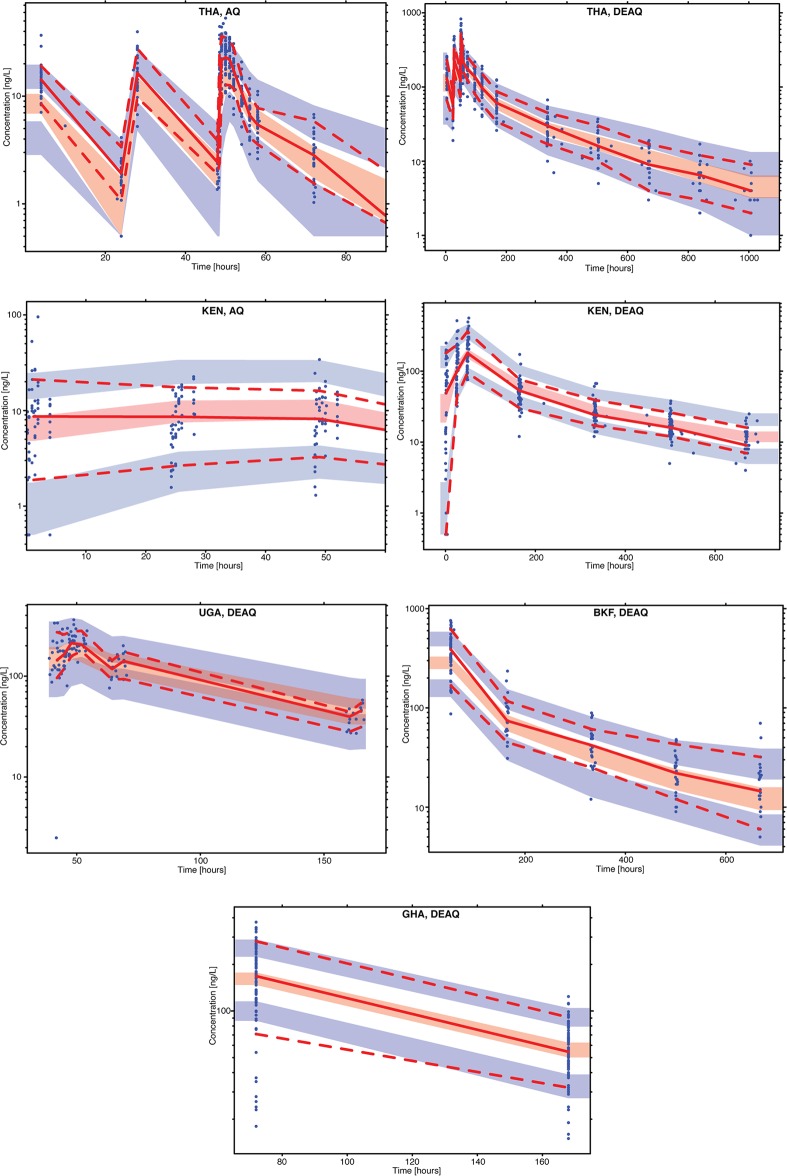
FIG 2.
Visual predictive check of the final model describing the plasma concentrations of amodiaquine (AQ) and desethylamodiaquine (DEAQ) versus time in uncomplicated malaria patients from Thailand (THA), Kenya (KEN), Uganda (UGA), Burkina Faso (BKF), and Ghana (GHA). Open circles are the observed data points; solid and dashed lines are the 50th, 5th, and 95th percentiles of the observed data; shaded areas are the simulated (n = 1,000) 95% confidence interval for the same percentile. The y axis represents the plasma concentration on the log scale. Censored data points below the lower limit of quantification were imputed as LLOQ/2 and included in the calculation of percentiles for the observed and the simulation data. The VPC for amodiaquine for both Thailand and Kenya was cut at times of 90 and 60 h, respectively, since beyond these times the concentrations from both observed and simulated data were below the LLOQ.

