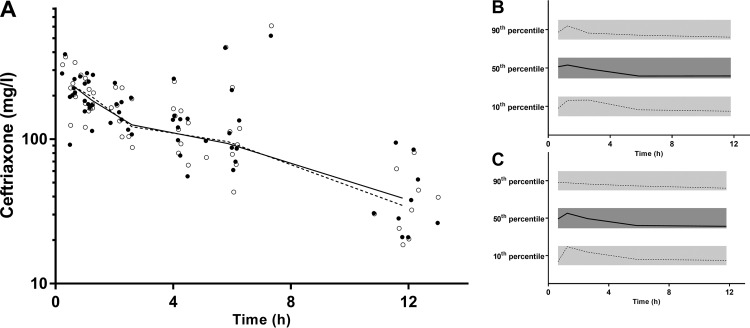
FIG 4.
(A) Time-concentration profile of ceftriaxone (mg/liter on a log10 scale) for dried blood spot-derived (DBS; open circles) and measured plasma concentrations (closed circles; DBS and plasma data points have been artificially separated to aid comparison). Graphs on the right are the prediction-corrected visual predictive checks (pcVPC) values for dried blood spot-derived (B) and measured plasma (C) concentrations, showing the 10th, 50th, and 90th percentiles with the actual data (solid and dashed lines) within their respective 95% prediction intervals (gray shaded areas).

