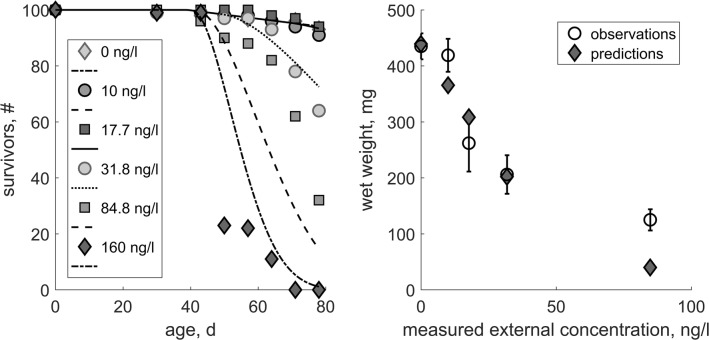
Fig. 1.
Calibration of the TKTD module. Comparison between model results and observations in Experiment 1 (the constant-exposure ELS study which was used to calibrate the TKTD module) for survival over time (right) and wet weight at the end of the test (left). Error bars represent the standard deviation

