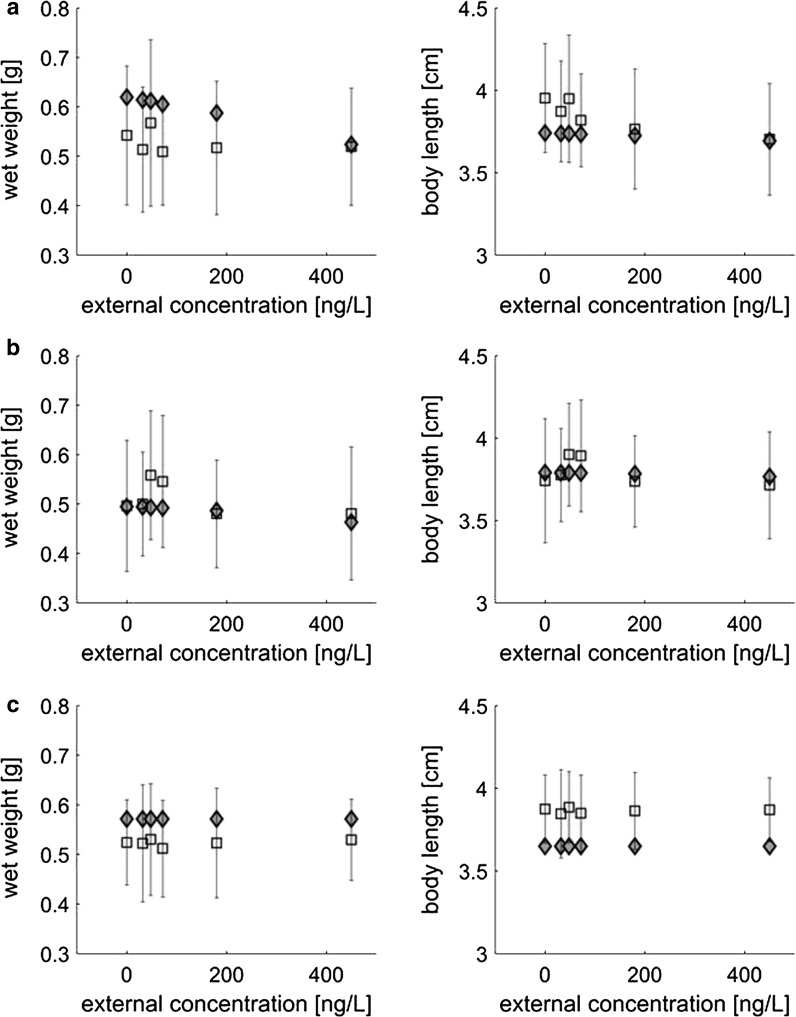
Fig. 2.
Results for Cohorts a– c for Experiment 2. Comparison between predicted and empirical weight (left) and length (right). Empirical data are only available for the end of assessment period (squared boxes with error bars, representing the standard deviation of the data). The grey diamond-shaped markers represent the model predictions

