
FIGURE 2.
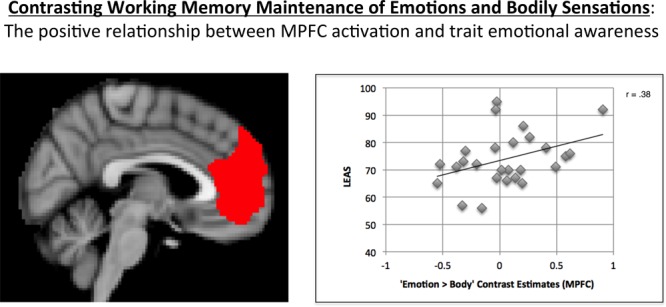
Illustration of the positive correlation observed between MPFC activation for the “Emotion > Body” contrast and LEAS scores. The MPFC ROI used is shown on the left. A scatterplot of the data is shown on the right, which illustrates the positive relationship observed.