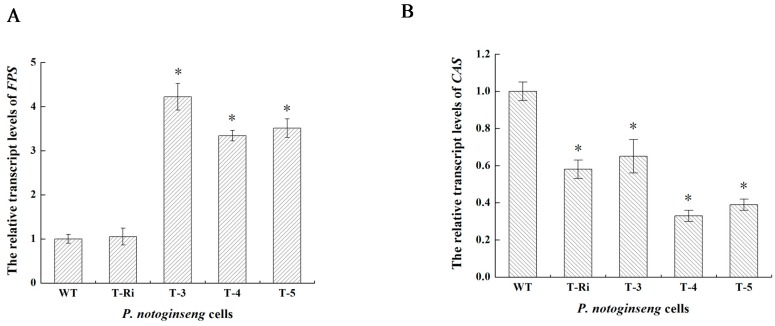
Figure 7.
The relative transcription levels of FPS and CAS in P. notoginseng cells. (A) The relative transcription levels of FPS; (B) The relative transcription levels of CAS; The internal reference is GAPDH. Vertical bars indicate mean values ± standard deviations (SDs) from three independent experiments (n = 3). The symbol * represents that there is a significant difference between WT (control) and transgenic cells at p < 0.05.

