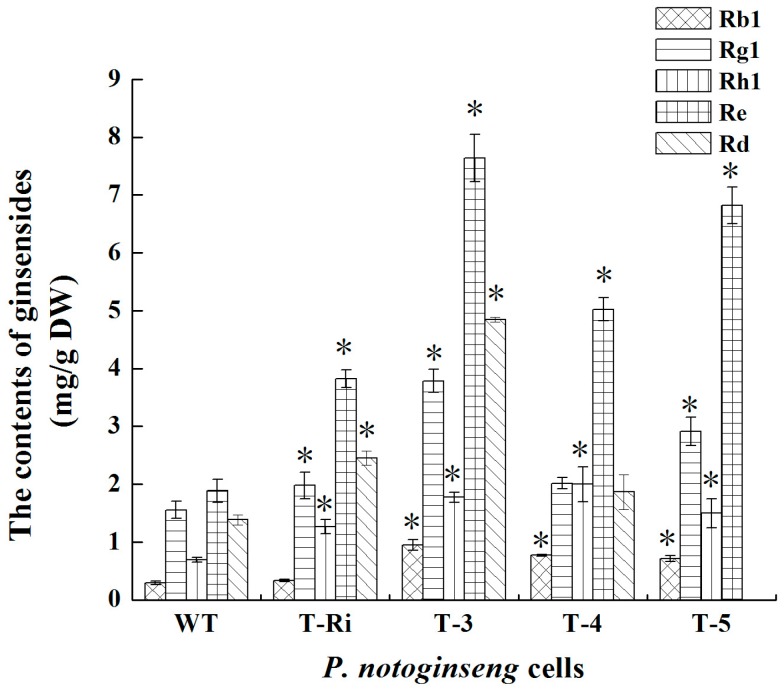
Figure 9.
The contents of five major ginsenosides (Rb1, Rg1, Rh1, Re and Rd) in P. notoginseng cell lines. Vertical bars indicate mean values ± SD from three independent experiments (n = 3). The symbol * represents that there is a significant difference between WT (control) and transgenic cells at p < 0.05.

