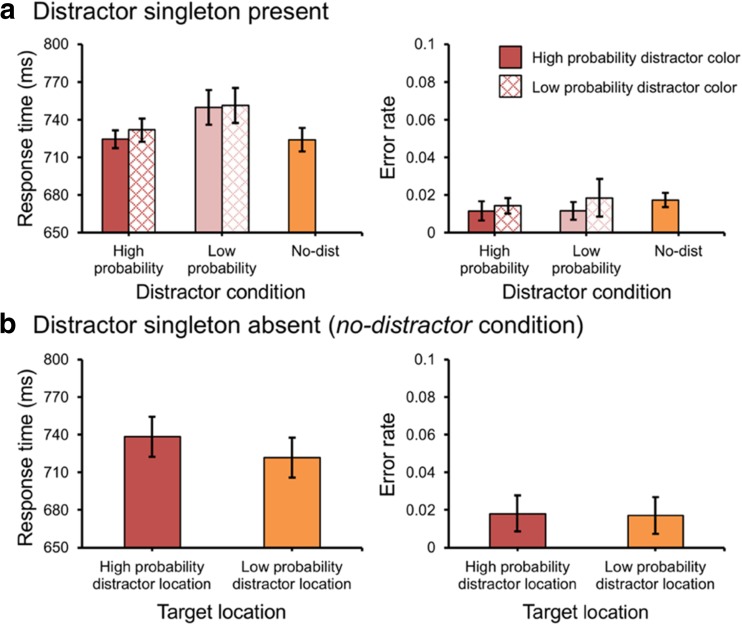
Fig. 5.
(A) The mean response times (RTs) (left panel) and mean error rates (right panel) between different distractor locations and different distractor colors in Experiment 3. (B) The mean RTs (left panel) and the mean error rates (right panel) in the no-distractor condition in Experiment 3. Error bars denote within-subjects 95% confidence intervals

