Figure 4.

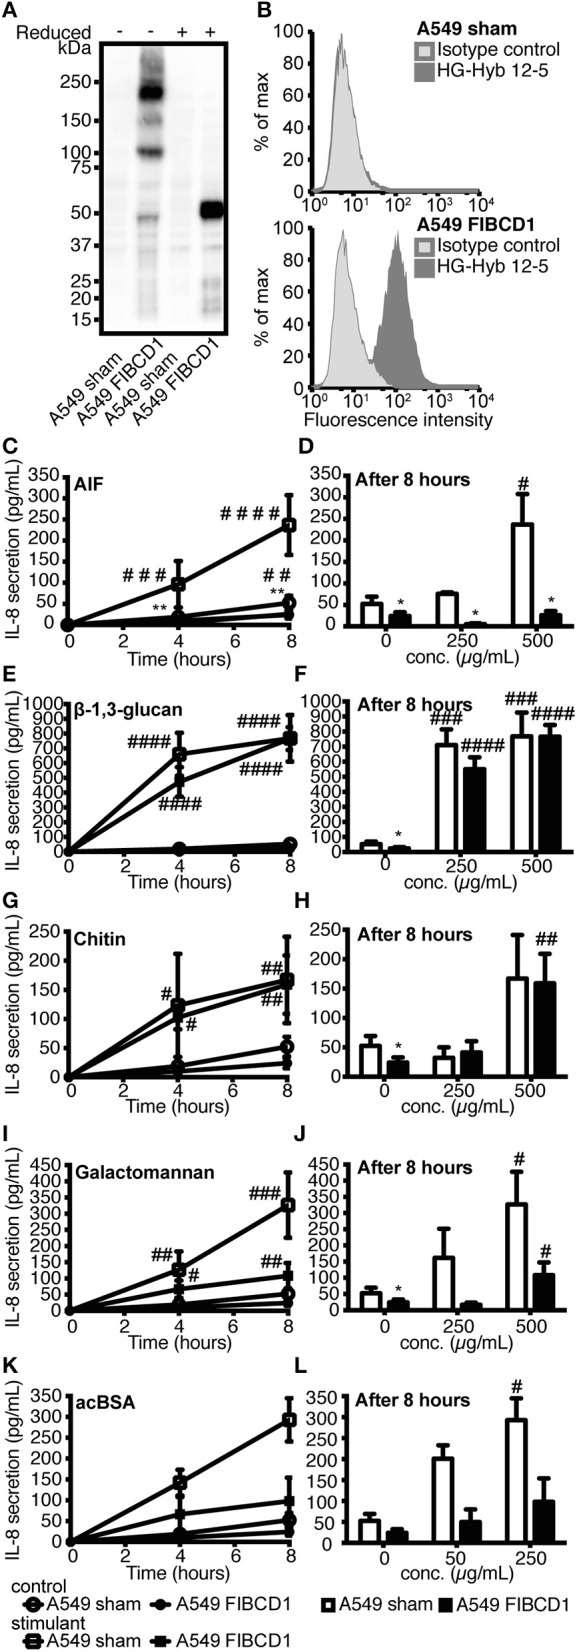
Overexpression of FIBCD1 on the surface of A549 cells inhibits secretion of IL-8. The phenotype of sham- and FIBCD1-transfected A549 cells was analyzed by Western blotting (A) and flow cytometry (B). (A) Western blot of cell lysate from sham- and FIBCD1-transfected A549 cells under reducing and non-reducing conditions revealed the presence of four known oligomeric forms of FIBCD1 in the FIBCD1-transfected cells when probed with the anti-FIBCD1 mAb clone HG-HYB 12-2. (B) Flow cytometry of sham- and FIBCD1-transfected A549 cells showed surface expression of FIBCD1 on FIBCD1-transfected cells and none on sham-transfected cells when using anti-FIBCD1 antibody HG-HYB 12-5 for detection. (C–L) A549 sham- and FIBCD1-transfected cells were seeded at a density of one million cells in 2 mL of media per well of a 6-well tissue culture plate and serum-starved overnight prior to stimulation with two different concentrations of several components associated with A. fumigatus or FIBCD1 for 0, 4, and 8 h and the concentration of secreted IL-8 was determined by sandwich ELISA as described. Left column: Time-dependent IL-8 secretion to 1,000 μg AIF (C), 1,000 μg β-1,3-glucan (E), 1,000 μg chitin (G), 1,000 μg galactomannan (I), or 500μg acBSA (K) per 2 mL medium. Right column: Dose-dependent IL-8 secretion after 8 h of stimulation with AIF (D), β-1,3-glucan (F), chitin (H), galactomannan (J), or acBSA (L). Data are presented as mean ± SEM from three independent experiments. Duplicate cell cultures were used for each of the three independent experiments and ELISA measurements were performed in duplicates on each of these. Data were analyzed by two-way ANOVA, following Tukey's test, #p < 0.05, ##p < 0.01, ###p < 0.001, and ####p < 0.0001 relative to 0 h or DPBS-treated cells. *p < 0.05 and **p < 0.01, relative to A549 sham cells stimulated with the same stimulant for the same time period.
