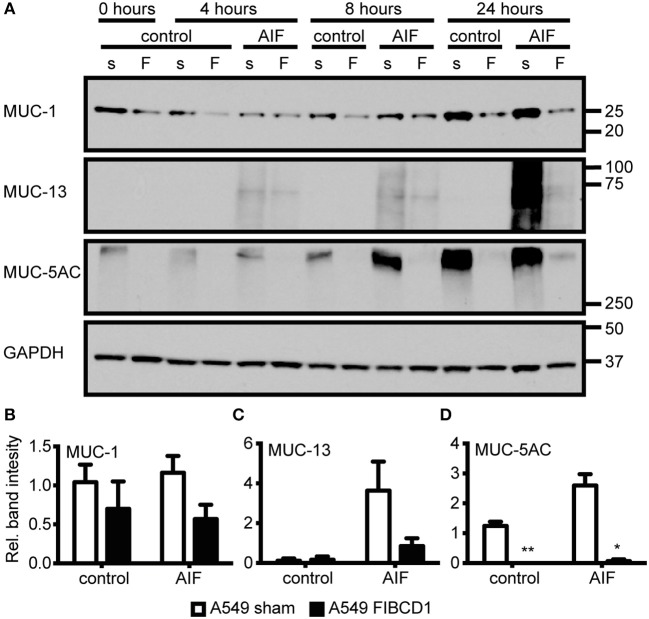
Figure 6.
Overexpression of FIBCD1 modulates mucin protein production. A549 sham- and FIBCD1-transfected cells were seeded at a density of one million cells in 2 mL of media per well of a 6-well tissue culture plate and serum-starved over night prior to incubation with DPBS or 500 μg/mL AIF in 2 mL serum-free media for 0, 4, 8, and 24 h. (A) Western blot analysis was performed as described using 19 μg of cell lysate per well. Lane 1, 3, 5, 7, 9, 11, 13: A549 sham-transfected cells, Lane 2, 4, 6, 8, 10, 12, 14: A549 FIBCD1-transfected cells. The Western blot shown is from one of three independent experiments yielding similar results. Color is adjusted to gray scale. (B–D) Western blots were quantified using ImageJ software. The values obtained after 8 h are expressed as mean ± SEM of the ratio of MUC-1 (B), MUC-13 (C), and MUC-5AC (D) to GAPDH from three independent experiments. Data were analyzed by two-way ANOVA, following Tukey's test, #p < 0.05, ##p < 0.01, and ###p < 0.001 relative to control cells. *p < 0.05, **p < 0.01, and ***p < 0.001 relative to A549 sham cells stimulated with the same stimulant.

