Fig. 1.
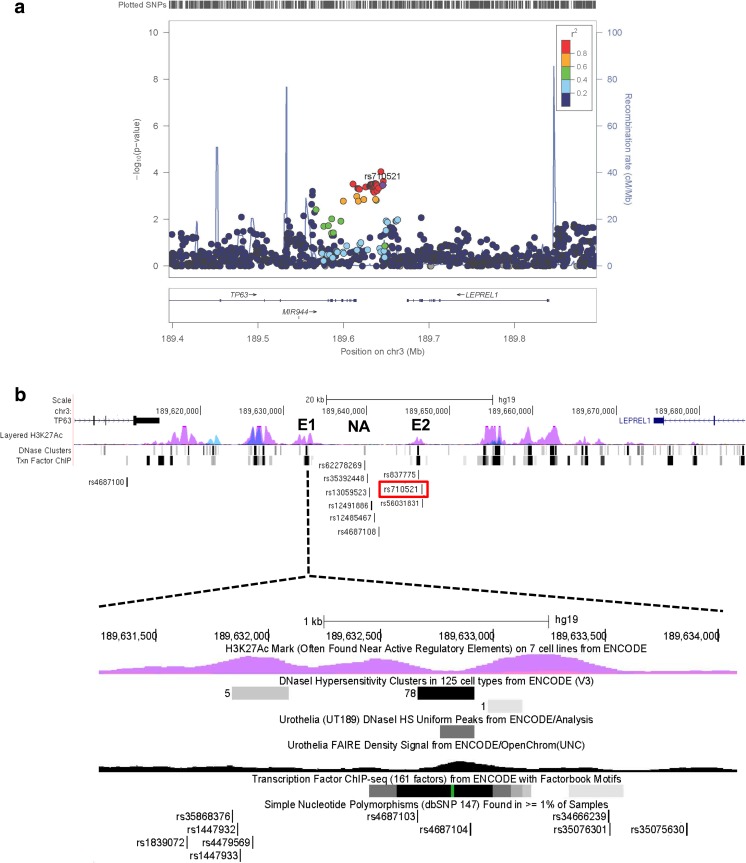
Fine-mapping of the original GWAS hit, rs710521, on 3q28. a Regional association plot showing SNPs in 3q28 and their association with bladder cancer risk. In total 20 SNPs are associated with bladder cancer risk (i.e. their p-values (y-axis) are equal/lower than those for rs710521 (purple dot) and are in high LD with rs710521 (r2 > 0.8). The SNPs are colored based on LD (r2) and their genomic positions are based on the hg19 EUR November 2014 version of the reference genome. The plot was created using LocusZoom software [46]. b Detailed overview of the TP63 and LEPREL1 gene locus, containing the 20 fine-mapped bladder cancer risk SNPs. The identified SNPs cluster in and around two enhancer regions (E1 and E2), which were assigned as enhancers based on the ENCODE regulatory data (i.e., presence of H3K27Ac histone marks, DNaseI hypersensitive sites and transcription factor binding sites). Rs4687100 maps to the last intron of the TP63 gene. Rs1839072, rs35868376, rs1447932, rs1447933, rs4479569, rs4687103, rs4687104, rs34666239, rs35076301 and rs35075630 map to enhancer region 1 (E1). Rs13089435 is located close to E1 in a region were H2K27Ac marks are absent (not shown). Rs62278269, rs35392448, rs13059523, rs12491886, rs12485497 and rs4687108 are located in a non-active region (NA). Rs837775 is located upstream of E2 in the non-active region. The original GWAS SNP, rs710521 (marked in red) and rs56031831 are located in E2. The numbers in the DNase clusters represent the number of ENCODE cell lines in which the region was DNase sensitive. The regulatory data for urothelia show the DNaseI hypersensitive peak and enrichment in the open chromatin structure revealed by FAIRE. Txn: transcription factor binding based on ChIP analysis. The images were downloaded from the UCSC Genome Browser (hg19) [47] and modified

