Fig. 2.
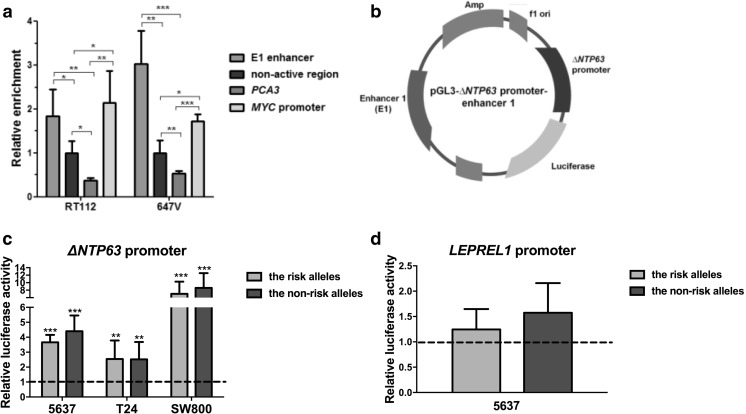
ΔNTP63/LEPREL1 promoter activity analysis of the E1 enhancer. a Enrichment in the open, nucleosome-depleted chromatin in the E1 enhancer region in two bladder cancer-derived cell lines, RT112 and 647 V, analyzed by FAIRE. All data are normalized to a non-active region within the TP63/LEPREL1 locus. b Schematic overview of the reporter vector (pGL3-ΔNTP63 promoter-enhancer) used for promoter-enhancer assays. Enhancer activity in 5637 (TP63 positive) and T24 and SW800 (TP63 negative) cells, using the enhancer part containing rs4687104 and rs4687103 with either the minor (non-risk) or the major (risk) alleles, on c ΔNTP63 and d LEPREL1 promoter activity is shown. Data are compared to the pGL3- ΔNTP63 promoter or the pGL3-LEPREL1 promoter-only construct, respectively (dashed line). All experiments were performed in triplicate and repeated at least three times using independent plasmid DNA isolations. Bars represent mean ± SD; *p < 0.05; ** p < 0.01; *** p < 0,001

