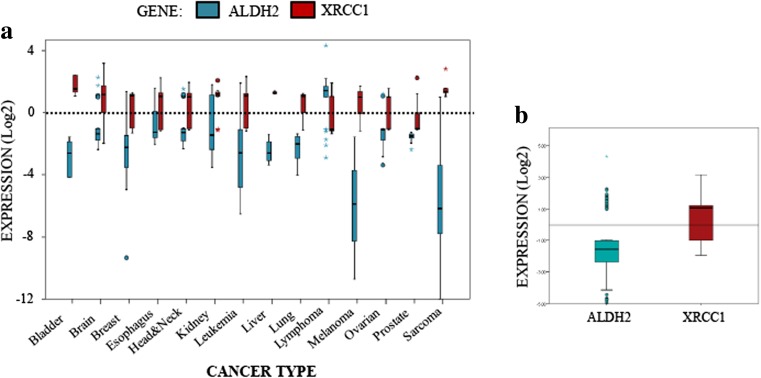
Fig. 2.
XRCC1 and ALDH2 mRNA levels mirror each other in most cancer types. a Boxplot summarising the fold changes in mRNA levels for ALDH2 (blue) and XRCC1 (red) depending on the cancer type. b Boxplot representing the overall variation in XRCC1 and ALDH2 mRNA levels in all cancer types. A list of the studies used and the associated mRNA fold changes can be found in Table S1

