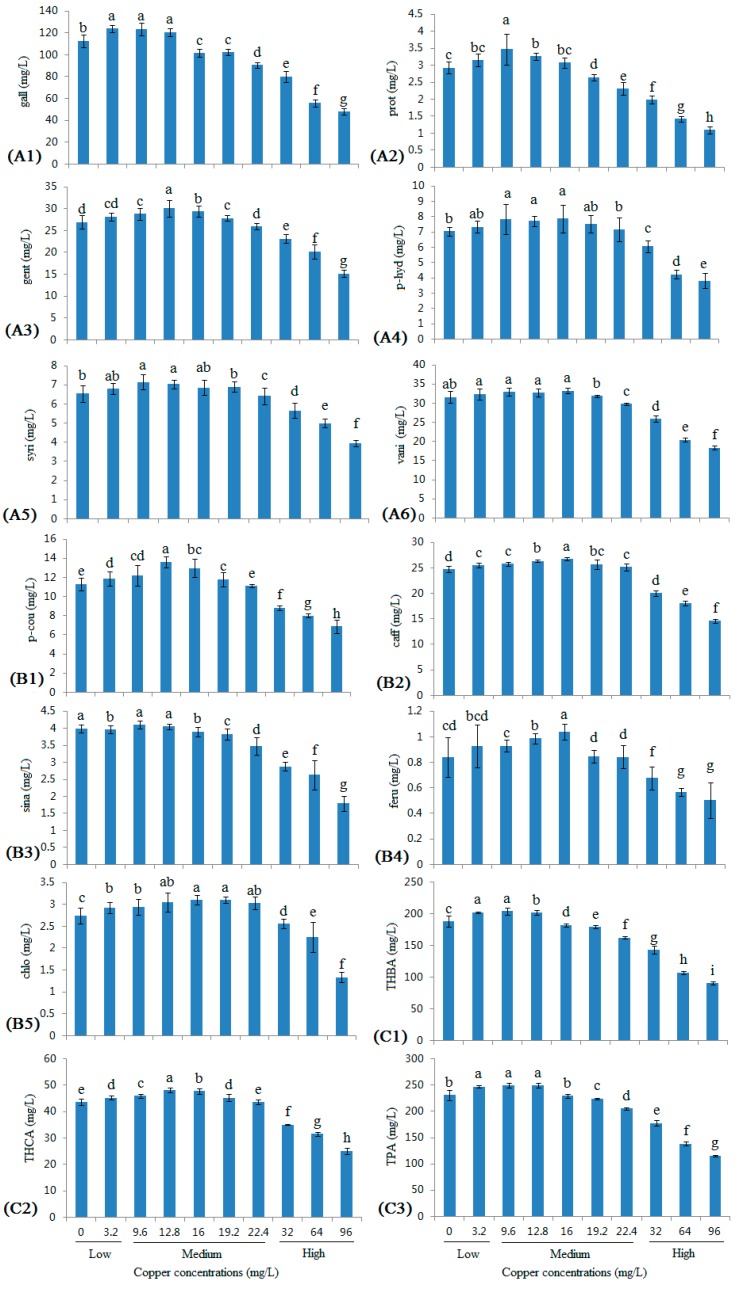
Figure 2.
Changes in monomeric phenolic acid contents in wine with different copper concentrations. (A1) Gallic acid; (A2) protocatechuic acid; (A3) gentisic acid; (A4) p-hydroxybenzoic acid; (A5) syringic acid; (A6) vanillic acid; (B1) p-coumaric acid; (B2) caffeic acid; (B3) sinapic acid; (B4) ferulic acid; (B5) chlorogenic acid; (C1) total hydroxybenzoic acids; (C2) total hydroxycinnamic acids; and (C3) total phenolic acids. Different letters indicate statistically significant differences (Duncan’s multiple range test, p < 0.05) between samples with different copper concentrations.

