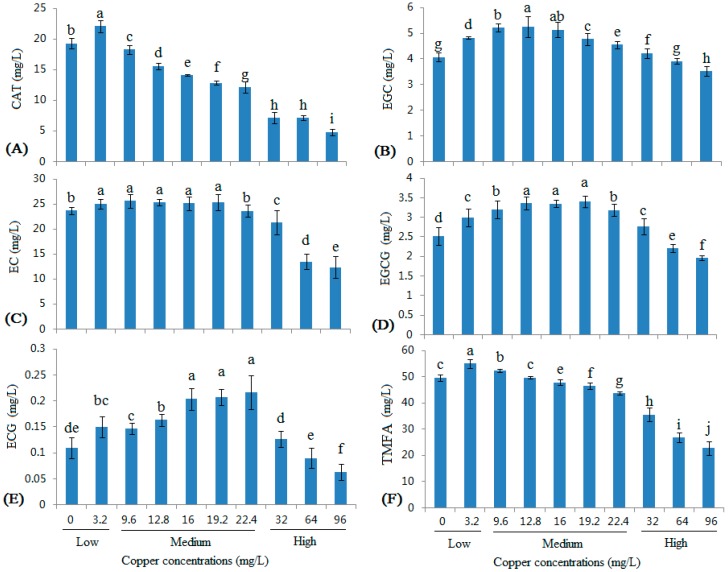
Figure 3.
Changes in monomeric flavan-3-ol contents in wine with different copper concentrations. (A) CAT ((+)-catechin); (B) EC ((−)-epicatechin); (C) EGC ((−)-epigallocatechin); (D) ECG ((−)-epicatechin gallate); (E) EGCG ((−)-epigallocatechin gallate); and (F) total flavan-3-ols. Different letters indicate statistically significant differences (Duncan’s multiple range test, p < 0.05) between samples with different copper concentrations.

