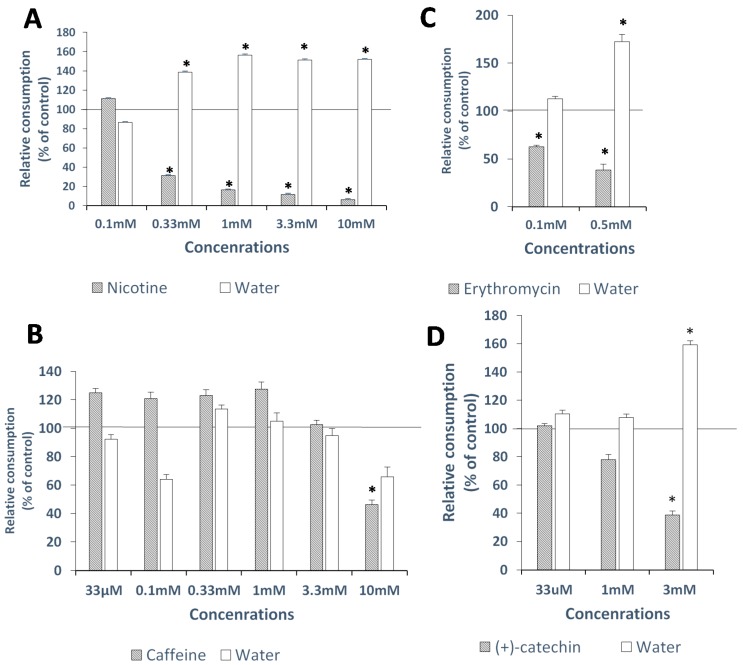
Figure 2.
Effects of different concentrations of bitter tastants on consumption parameters. Tastant side consumption (filled bars: (A) Nicotine; (B) Caffeine; (C) Erythromycin; (D) (+)-Catechin) and water side consumption per chick (open bars) as percentage of control, during 24 h. Consumption parameters were normalized to the distilled water control group (=100%, indicated by black line at 100). Bars represent consumption (represented as percentage of control group) ±SEM. * Significantly different (p ≤ 0.05) from control group using Dunnett’s Method.

