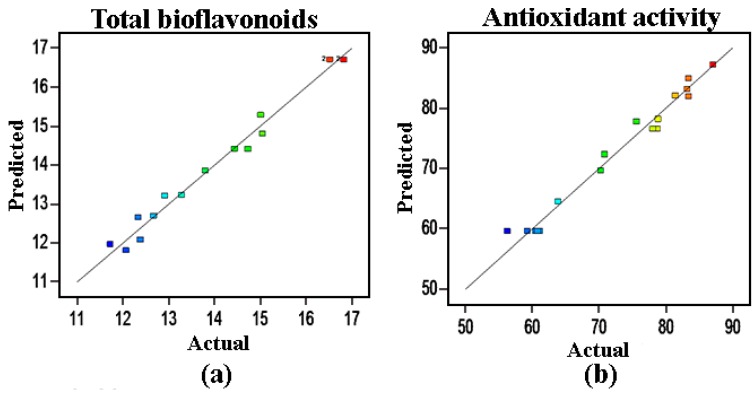
Figure 3.
Correlation graph between the predicted and experimental yield values. (a) The correlation graph of total biflavonoids content, color points from red to blue indicate values of bioflavonoids changing in the scope of 11 ~ 17 mg/g; (b) The correlation graph of antioxidant activity, color points from red to blue indicate values of IC50 changing in the scope of 50 ~ 90 μg/mL.

