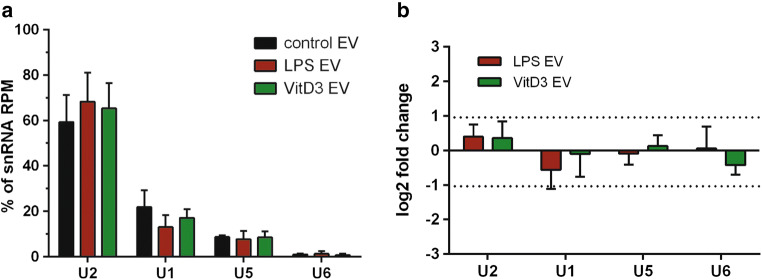
Fig. 4.
EV from LPS- and VitD3-stimulated DC display stable levels of abundant snRNAs. EV-associated RNA from control, LPS, and VitD3 conditions was isolated and analyzed by RNA sequencing. Read counts for individual RNAs were normalized to the total read counts of each RNA class. a Read counts for the top-four most abundant snRNAs, constituting 96% of snRNA reads in EV-RNA, are expressed as percentage of the total snRNA read count in EV. b Data from a are expressed as fold change in the indicated snRNA levels of VitD3- or LPS-EV relative to control-EV (mean ± SD of n = 3 experiments; in one-way ANOVA, no significant differences were observed)

