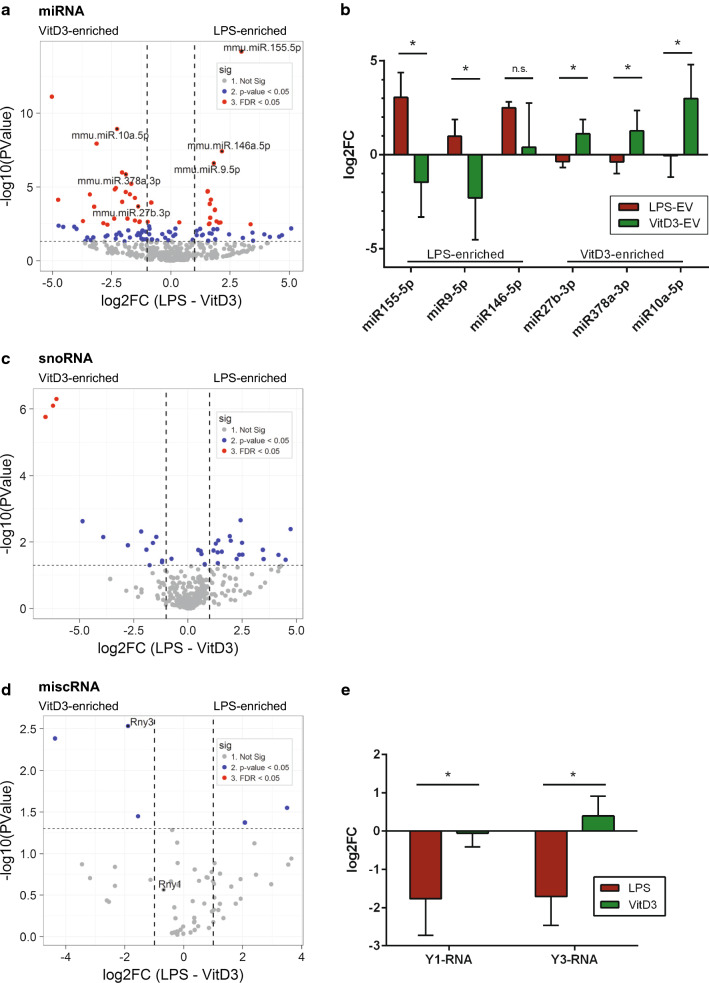
Fig. 5.
EV from LPS-/VitD3-stimulated DC display differences in the levels of several miRNAs, snoRNAs, and Y-RNAs. EV-associated RNA from control, LPS, and VitD3 conditions was isolated and analyzed by RNA sequencing. Read counts for individual RNAs were normalized to the total read counts of each RNA class. LPS- or VitD3-induced fold changes and corresponding p values were calculated relative to the control condition. a Volcano plots of EV-associated miRNAs in LPS versus VitD3 conditions. Thresholds for twofold change and non-adjusted p < 0.05 are indicated. Data points represent average values of n = 3 biological replicates. Significant changes are indicated with different colours. Grey: non-significant, blue: non-adjusted p value < 0.05, and red: FDR < 0.05. b RT-qPCR validation of six miRNAs showing differential abundance between LPS-EV and VitD3-EV. Data are expressed as log2fold change in LPS- and VitD3-EV compared to control-EV. Indicated are the mean ± SD values of n = 4 independent experiments, one-way ANOVA, *p < 0.05. Volcano plots of EV-associated snoRNAs (c) and miscRNAs (d) in LPS versus VitD3 conditions. Thresholds for twofold change and non-adjusted p < 0.05 are indicated. Data points represent average values of n = 3 biological replicates. Significant changes are indicated in different colours. Grey: non-significant, blue: non-adjusted p value < 0.05, red: FDR < 0.05. e RT-qPCR validation of Y3 and its family member Y1 showing differential abundance between LPS-EV and VitD3-EV compared to control-EV. Indicated are the mean ± SD values of n = 4 independent experiments, one-way ANOVA, *p < 0.05

