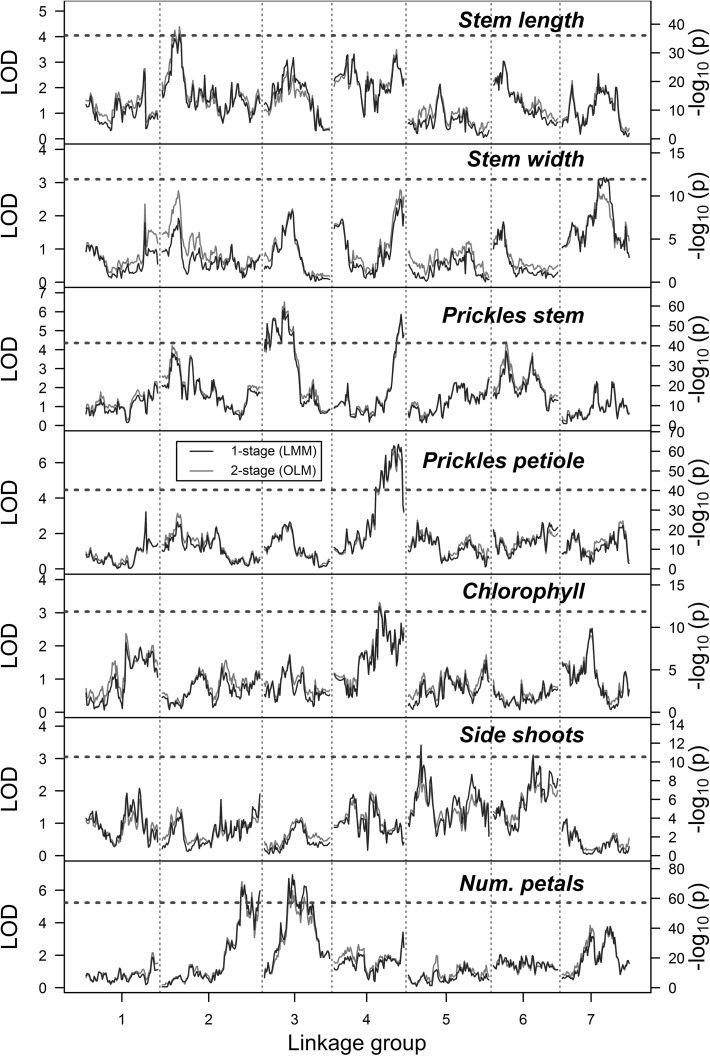
Fig. 2.
Comparison of the QTL results using a one-stage linear mixed model approach versus a two-stage analysis using BLUEs in an ordinary linear model. Significance thresholds, as determined by permutation tests (N = 1000, α = 0.05), are shown as dashed red lines (data were re-scaled so that these overlap). The one-stage results (− log10(p) values) are shown in blue, with the two-stage results (LOD scores) shown in red (color figure online)

