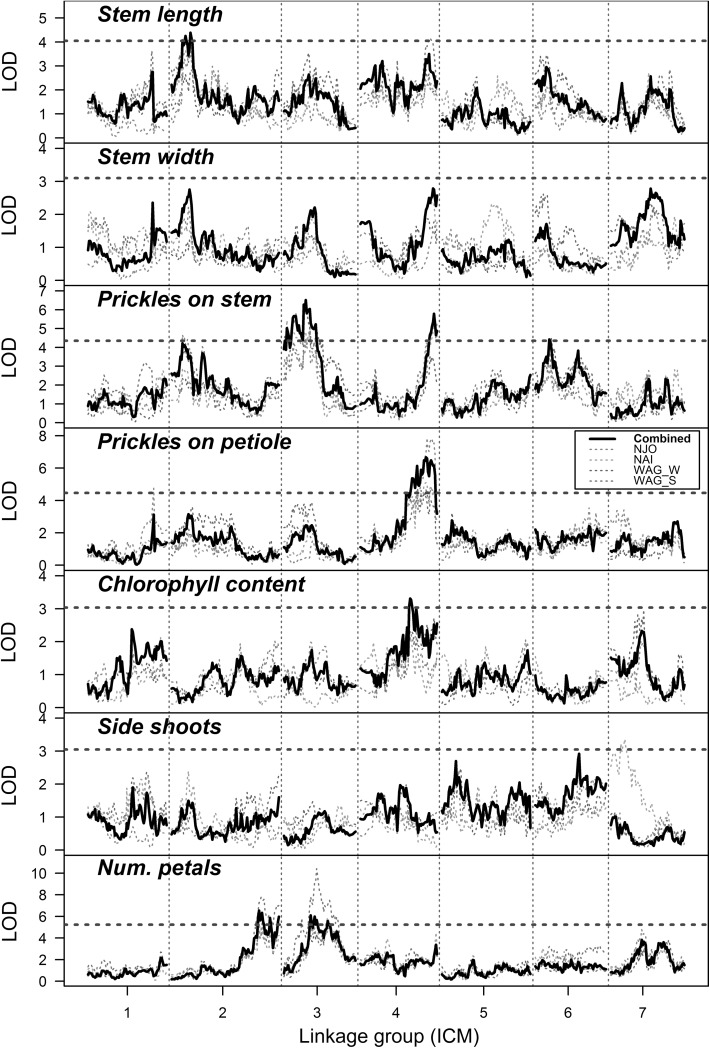
Fig. 3.
LOD profiles of QTL scans for morphological traits across different growing environments in the K5 tetraploid rose population using the two-stage approach. The results from single-environment analyses are shown as coloured dashed lines, with the multi-environment analysis results as a solid black line (“Combined”). Environments tested were Njoro (“NJO”), Nairobi (“NAI”), Wageningen winter (“WAG_W”) and Wageningen summer (“WAG_S”). Significance thresholds for the multi-environment analysis, as determined by permutation tests, are shown as red dashed lines. Single-environment LOD profiles (dashed QTL lines) were re-scaled so that the significance thresholds of all plots coincided precisely, i.e. the y-axis LOD scales are only correct for the combined analysis (solid black line) (color figure online)

