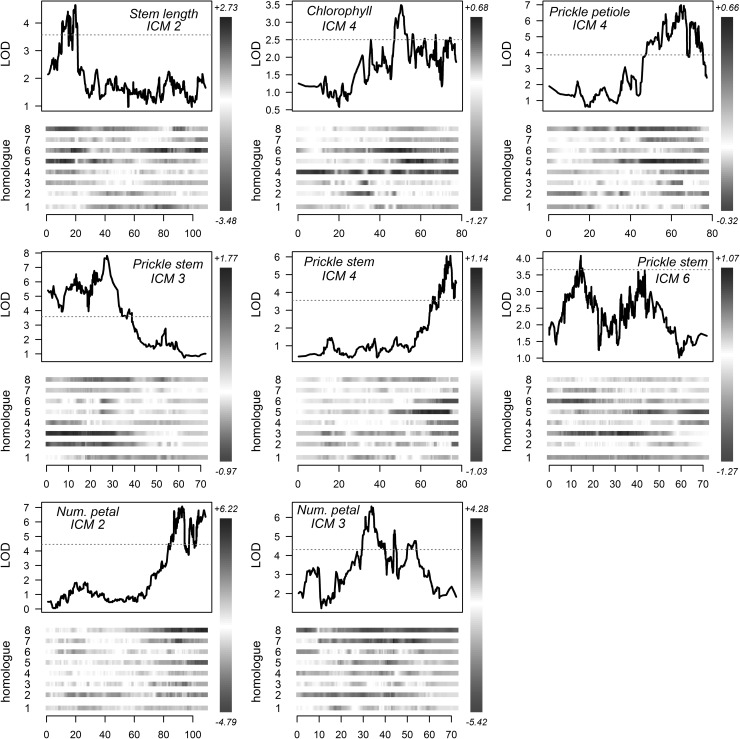
Fig. 4.
Allelic effects around QTL peaks detected for the morphological traits stem length, chlorophyll content, prickles on petiole and stem, and number of petals. For each QTL peak, the IBD-weighted phenotype mean contribution of each parental homologue (1–4 for parent 1 and 5–8 for parent 2) are shown below the LOD profile, with darker blue representing a positive influence on the trait, and red a negative influence. LOD significance thresholds as determined by permutation tests (N = 1000, α = 0.05) are shown as dotted red lines. The range of allele effects (+/−) is shown above and below the scale to the right of each plot. LOD profiles correspond to a two-stage QTL analysis using single-environment BLUEs as described in the main text. Chromosome numbering (ICM) is according to the integrated consensus map numbering of Spiller et al. (2011) (color figure online)

