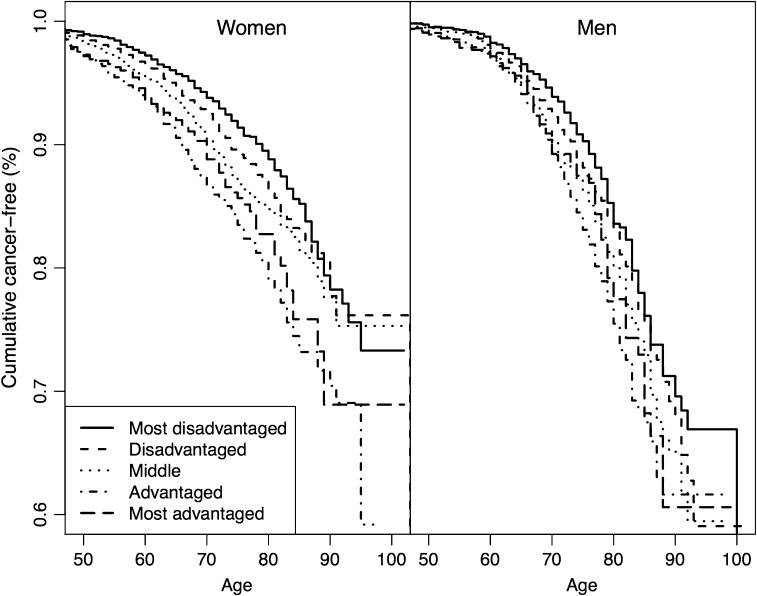
Fig. 1.
Kaplan–Meier curve for the cumulative proportion of cancer-free participants over time by gender and childhood socioeconomic conditions (the Survey of Health, Ageing and Retirement in Europe, collected in Austria, Belgium, Czech Republic, Denmark, France, Germany, Greece, Ireland, Italy, the Netherlands, Poland, Spain, Sweden, and Switzerland, 2016). Note: in the analyses, age started at birth, but is presented from age 50 onwards in the figure

