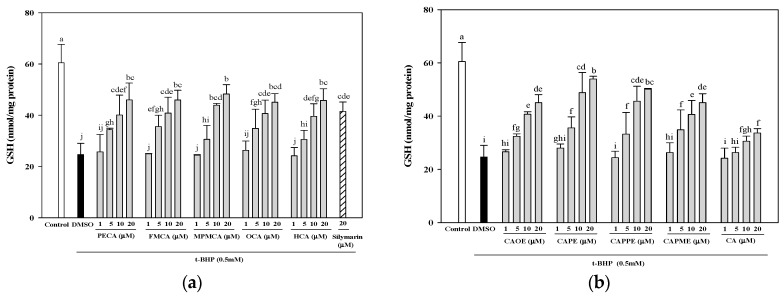
Figure 5.
Effects of caffeic acid derivatives on the glutathione levels in HepG2 cells after the oxidative damage induced by t-BHP. Pre-treatment with caffeamide derivatives (a) and caffeate derivatives (b) for 24 h, HepG2 cells were stimulated with t-BHP (0.5 mM) for 24 h. The vehicle and positive controls respectively received DMSO (0.1%) and silymarin (20 μM). The amount of cellular glutathione level is expressed as nmol/mg protein. Values were shown as mean ± SD (n = 3). Data were analyzed by one-way ANOVA and Duncan multiple comparison test. Values not sharing the same letter are significantly different at p < 0.05.

