Figure 6.
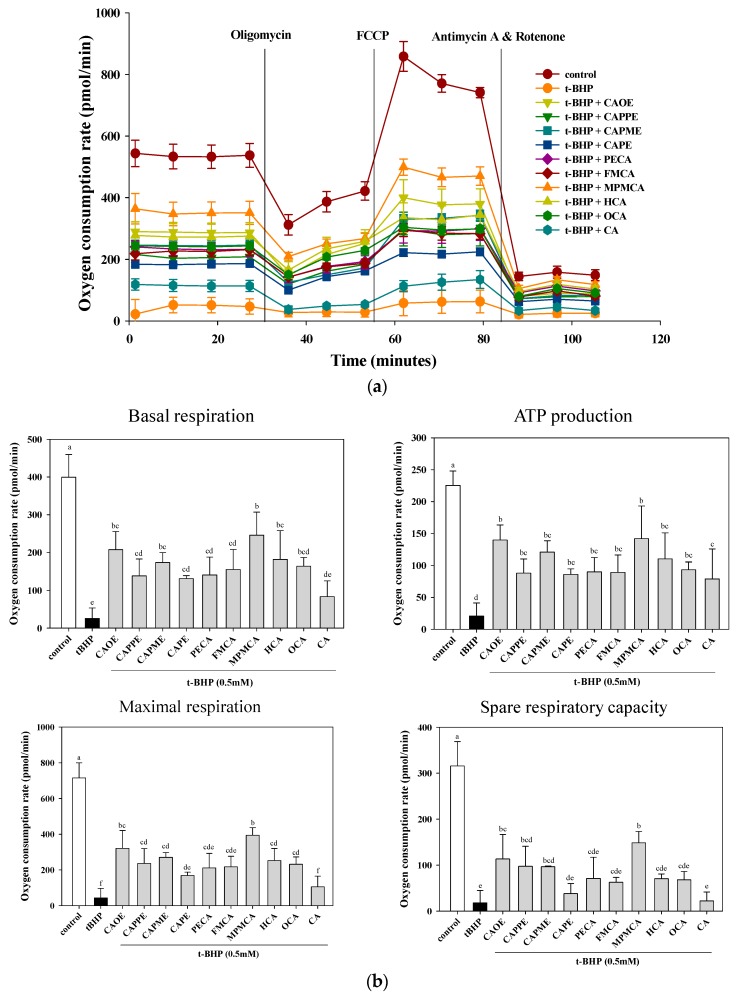
Effect of CA derivatives on t-BHP-induced mitochondria dysfunction. HepG2 cells were treated with CA and CA derivatives (20 μM) or control (vehicle, 0.1% DMSO) for 6 h, followed by 0.5 mM t-BHP for an additional 2 h. Respiration curve (a) and statistical analyses of basal, maximal and spare mitochondrial respiration capacity, and ATP production (b) were analyzed. Values were shown as mean ± SD (n = 3). Data were analyzed by one-way ANOVA and Duncan multiple comparison test. Values not sharing the same letter are significantly different at p < 0.05.

