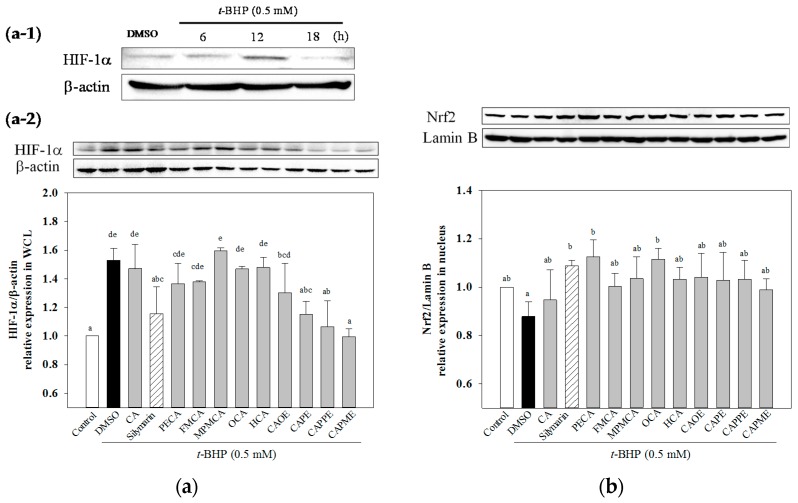
Figure 7.
Effect of CA derivatives on HIF-1α and Nrf2 protein levels in t-BHP-treated HepG2 cells. Cells were treated with t-BHP (0.5 mM) alone for the indicated times (a-1). Pre-treatment with test compounds (20 μM) for 24 h, cells were then stimulated with t-BHP (0.5 mM) for 12 h (a-2). The equal amounts of whole cell lysate (WCL) were subjected to immunoblotting to determine the HIF-1α level. Quantification of protein levels was normalized to β-actin (a). Pre-treatment with test compounds (20 μM) for 24 h, cells were treated with t-BHP (0.5 mM) for 12 h. Then, equal amounts of nuclear protein were subjected to western blot analysis to determine the Nrf2 level. Quantification of protein levels was normalized to lamin B (b). The vehicle and positive controls respectively received DMSO (0.1%) and silymarin (20 μM). Results were expressed as mean ± SD of three experiments. Data were analyzed by one-way ANOVA and Duncan multiple comparison test. Values not sharing the same letter are significantly different at p < 0.05.

