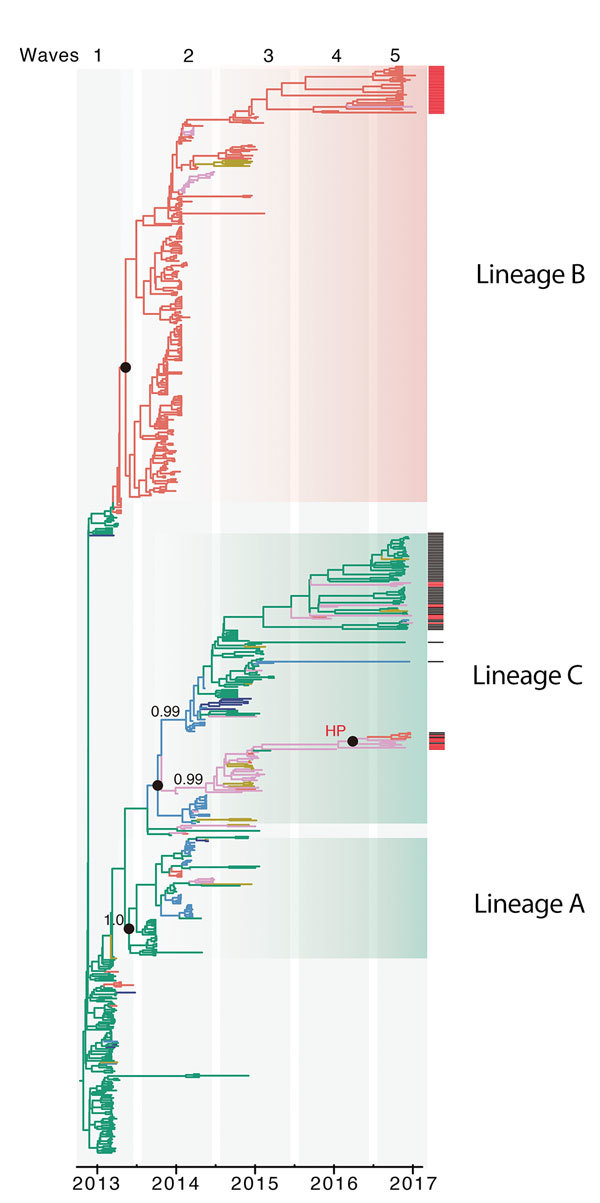
Figure 2.

Genetic evolution and spatial spread of epidemic lineage of influenza A(H7N9) viruses, China, 2013–2017. Bayesian maximum clade credibility tree of the hemagglutinin gene is shown. Black bars to the right of the tree indicate sequences (from waves 4 and 5) from other studies (1,5), and red bars indicate sequences reported in this study from Guangdong Province. Branch colors indicate most probable ancestral locations of each branch. Three major lineages (A, B, and C) of H7N9 viruses were observed. Values along branches indicate bootstrap values. Black circles indicate posterior support >0.95. Location of posterior support is shown for selected clades. An H7N9 strain closely related to the highly pathogenic H7N9 virus cluster is indicated. HP, highly pathogenic.
