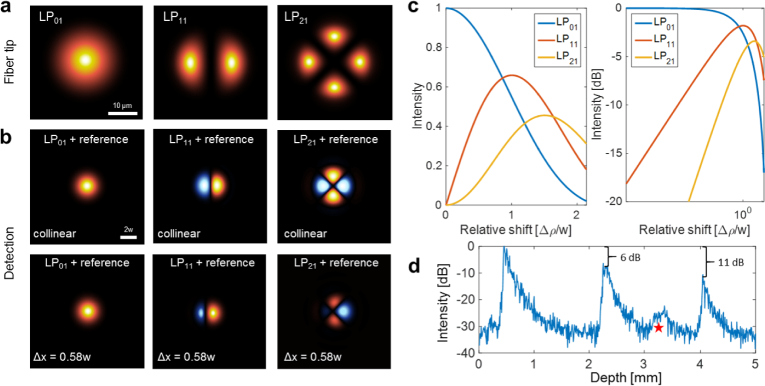
Fig. 2.
Interference of fiber modes. (a) Intensity distributions of modes LP01, LP11 and LP21 supported by the FMF. (b) Interference beam profiles simulated for a perfect alignment (upper row) and for an asymmetric interference pattern where the spots have been displaced by 0.58w (bottom row). (c) Modal intensities with respect to the relative shift Δρ/w between sample and reference beam. (d) Relative signal-to-noise ratio for the different FMF modes measured with a scattering paper in the sample position. The red star indicates a higher-order mode that appears close to the noise level in our interference signal. This mode was disregarded in the imaging experiments due to its weak intensity and strong dispersion.

